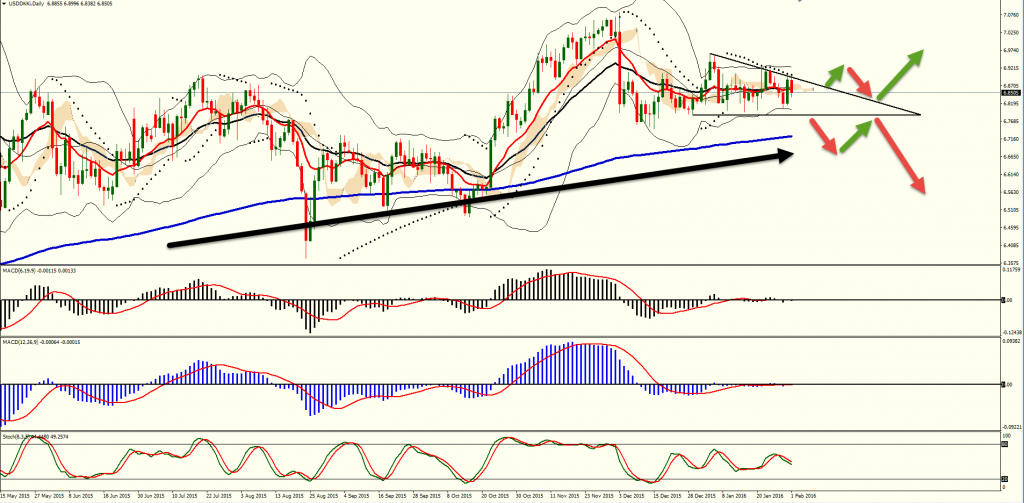
On this daily usddkk chart we see a descending triangle.
Price is respecting the upper and lower resistance lines and nearing the appex.
The level of the support is 6.7800
The level of resistance is 6.8900
Normally a descending triangle means an outbreak to the downside.
I advise to wait for a close below support or over the resistance and trade in the same direction of the outbreak.
As a guideline for a profit target you might take the hight of the pattern 160 pips and plot it at the area of the outbreak.
BEST OF PIPS