27 Januari 2016 4:02 AM
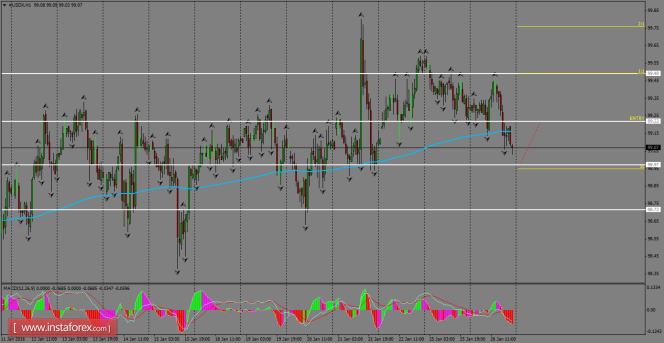
US Dollar Index has declined below the 200 SMA at H1 chart after a strong resistance was found around 99.49. Current price action is telling us that a support level is located at 98.97, as an inflection zone was formed during the January 19th and 20th sessions and pushed the index higher. However, this bullish scenario can invalidate if the USDX breaks the support at 98.72. MACD indicator is currently declining, as it is still moving on the negative territory.

H1 chart's resistance levels: 99.22 / 99.49
H1 chart's support levels: 98.97 / 98.72
Trading recommendations for today: Based on the H1 chart, buy (long) orders only if the USD Index breaks a bullish candlestick; the resistance level is at 99.22, take profit is at 99.49, and stop loss is at 98.95.
The material has been provided by InstaForex Company - www.instaforex.com


