
There are several important levels in AUDCAD H4:
- Up-trendline. This is the line which represents support for the prices. As you see the market several times touched this line and price turned its direction.
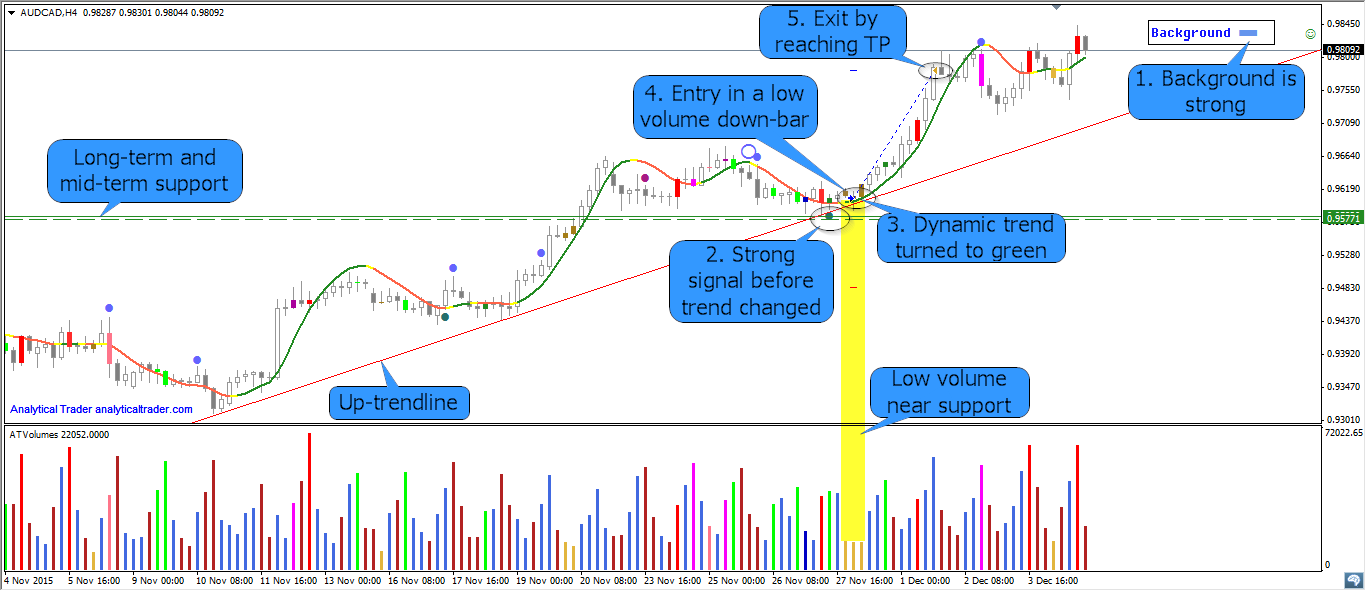
- Long-term and mid-term support (They are very close to each other. Dashed line – mid-term support, solid line – long-term support). If we look at the left part of the chart (is not shown in the picture), we can notice that earlier this support was a resistance level. It is a very common pattern when resistance is broken it becomes a support level.
This trade was opened when the market has approached the long-term support and touched the up-trendline. I want to draw your attention to the 3 narrow spread bars with low volume near support. It is called “no selling pressure” which shows that professionals are not interested in lower prices and it is highly unlikely that the support will be broken in this place.
1. Background was strong.
2. Strong signal (Minor Demand) before trend changed.
3. Dynamic trend turned from red to green.
4. Entry in a low volume down-bar.
5. Exit by reaching TP level.
Total: + 175 Pips


")
")