
GBP/USD Price Action Analysis - ranging bearish with descending pattern to be formed
2 November 2015, 09:11

0
1 304
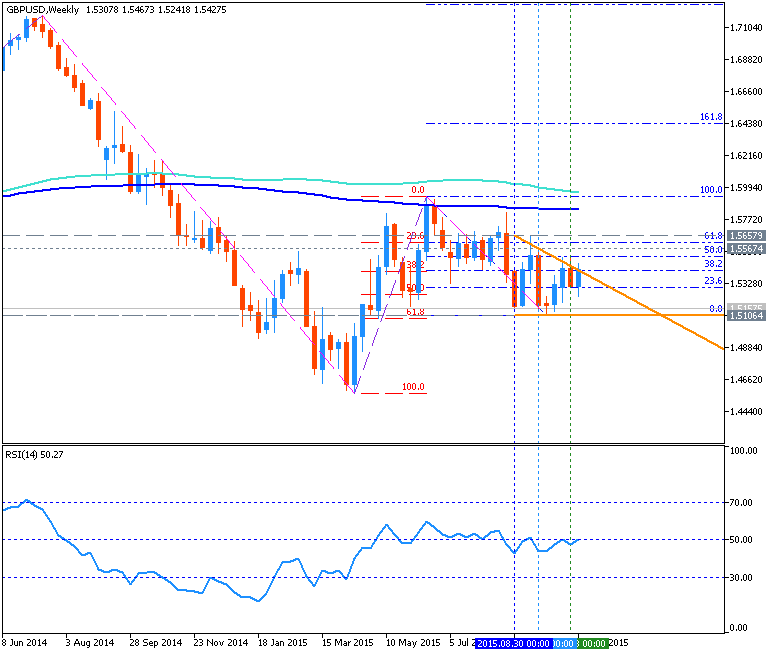
W1 price is located below 200 period SMA
(200 SMA) and 100 period SMA (100 SMA) for the primary bearish market
condition with the secondary ranging between Fibo resistance level at
1.5929 and Fibo support level at 1.5106:
- the price is ranging near 38.2% Fibo level and 23.6% Fibo level;
- "support is
estimated in the mid-1.0800s. Resistance is estimated in the mid-1.1400s
(May and June high are 1.1435/65). A break on either side would
indicate potential for a larger move."
- "The long term tradable slope in GBP/USD is best described by the line that extends off of the 2009 and 2011 highs and its associated parallels. Right now (10/30) is trading 'no man’s land' (not at support and we’re not at resistance) but resistance is 1.5800-1.6000…if it gets there."
- bullish reversal resistance level for this pair is 1.5929 located on the border between the primary bearish and the primary bullish on the chart;
bearish resistance level for the pair is 1.5106 located far below 200 SMA/100 SMA on the primary bearish area of the chart; if the price crosses this level from above to below so the bearish breakdown will be started with the good price movement.
Trend:
- D1 - ranging bearish
- W1 - ranging bearish
- MN1 - ranging bearish


 Trading Guide")
")
