EUR/USD Intra-Day Technical Analysis - waiting to break the levels
19 August 2015, 08:51

2
3 323
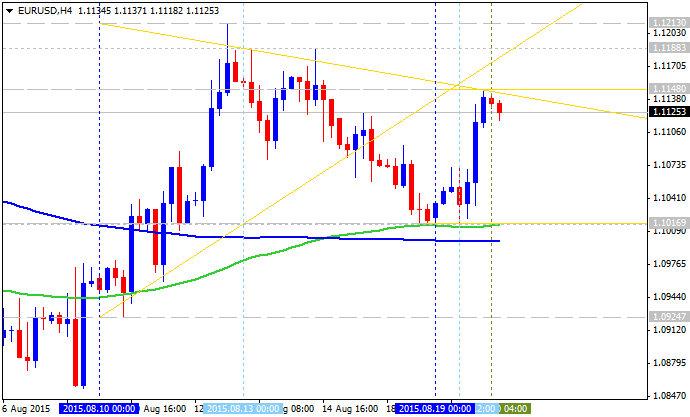
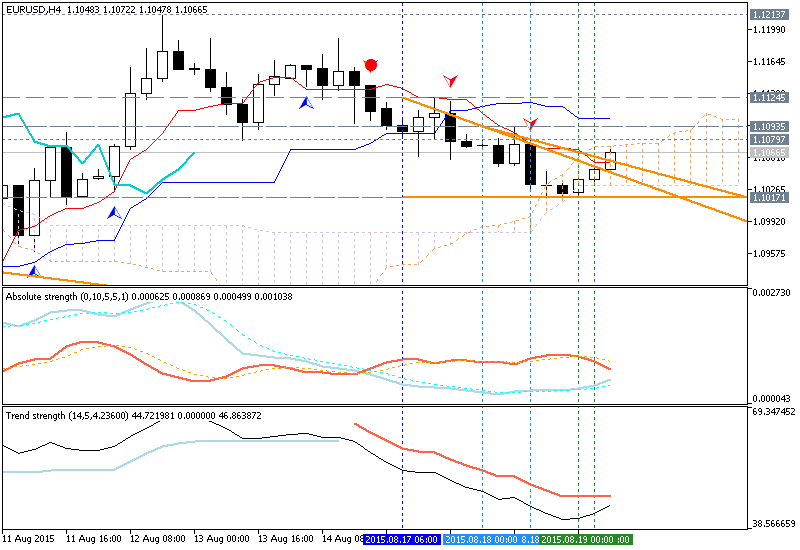
H4 price is located to be inside Ichimoku cloud for ranging market condition between Senkou Span lines on the border between the primary bearish and the primary bullish trend on H4 chart. The key support/resistance levels are the following:
- 1.1017 support level located below Ichimoku cloud in the beginning of the bearish area of the chart, and
- 1.1124 resistance level located above Ichimoku cloud in the beginning of the bullish area of the chart.
Chinkou Span line is located below the price for bearish conditon indicating the secondary ranging by direction.
- The price is ranging between 1.1017/1.1124 key levels.
- Tenkan-sen line crossed Kijun-sen line of Ichimoku indicator for the bearish trend in the near future.
- The nearest support levels are 1.1030 (intermediate support) and 1.1017 (key support).
- The nearest resistance levels are 1.1093 (intermediate resistance) and 1.1124 (key resistance).
| Resistance | Support |
|---|---|
| 1.1093 | 1.1030 |
| 1.1124 | 1.1017 |
If
H4 price will break 1.1017 support level on close H4 bar so the primary bearish will be started with good breakdown possibility.
If H4 price will break 1.1124 resistance level so we may see the bullish breakout.
If not so the price will be ranging within the levels.
- Recommendation for long: watch close H4 price to break 1.1124 for possible buy trade
- Recommendation
to go short: watch H4 price to break 1.1017 support level for possible sell trade
- Trading Summary: ranging
SUMMARY : ranging