
Quick Technical Overview - Dow Jones Industrial Average: levels and ideas
5 August 2015, 03:11

0
829
Weekly price is on bullish market condition for ranging between 17396.4 support level and 18350.3 resistance level:
- Chinkou Span line is indicating the ranging condition.
- The nearest resistance levels are 18186.2 and 18350.3.
- The nearest support levels are 17396.4 and 17033.05.
- Absolute Strength indicator is estimating the secondary ranging within the primary bullish.
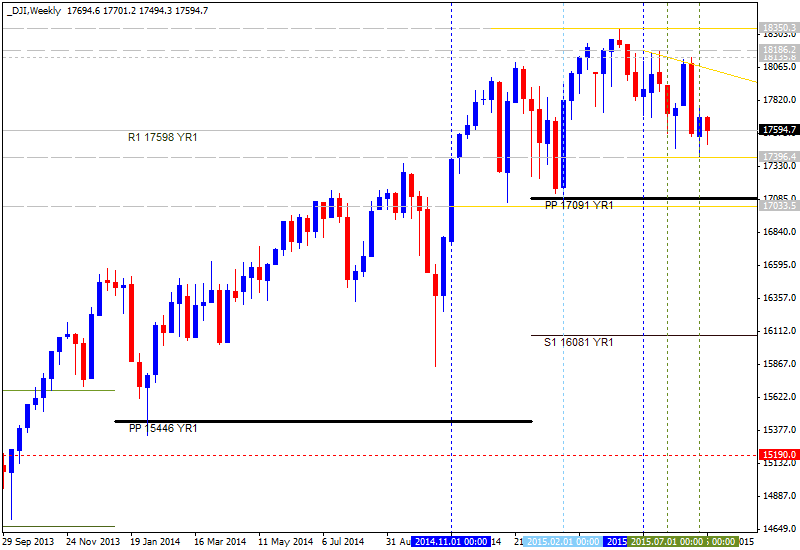
- Pivot Points (yearly PP on weekly chart): the price is ranging between yearly Central Pivot at 17091 and R1 Pivot at 18841.
| Instrument | S1 Pivot | Yearly PP | R1 Pivot |
|---|---|---|---|
| DJI |
16081 |
17091 |
18841 |
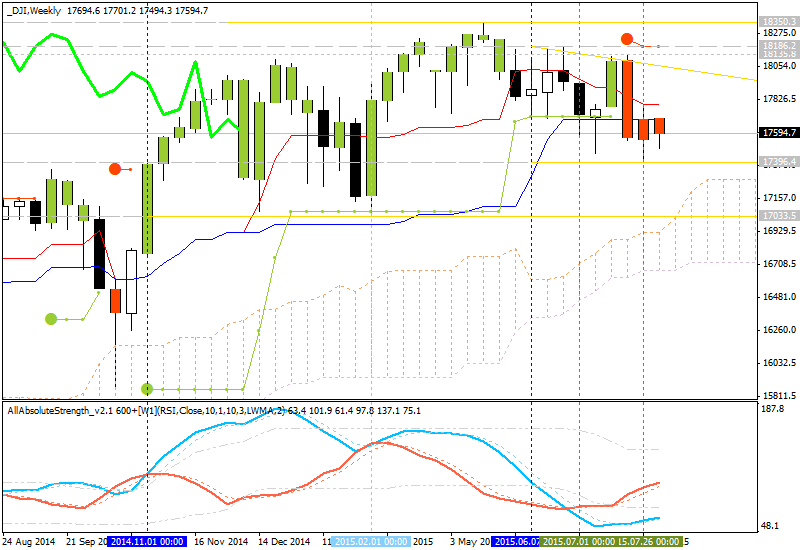
If W1 price will break 17396.4
support level so the secondary correction will be
started.
If W1 price will break 17033.5
support level so we may see the reversal of the price movement from the primary bullish to the primary bearish market condition.
If W1 price will break 18350.3
resistance level on close W1 bar so the bullish trend will be
continuing.
If not so the price will be ranging between the levels.
Trend:


