Technical Analysis for US Dollar, S&P 500, Gold and Crude Oil
3 July 2015, 15:11

1
1 653
US DOLLAR TECHNICAL ANALYSIS - Prices advanced as expected after prices put in a bullish Morning Star
candlestick pattern. Near-term resistance is at 11937, the 50% Fibonacci
expansion, with a break above that on a daily closing basis exposing
the 61.8% level at 11985.
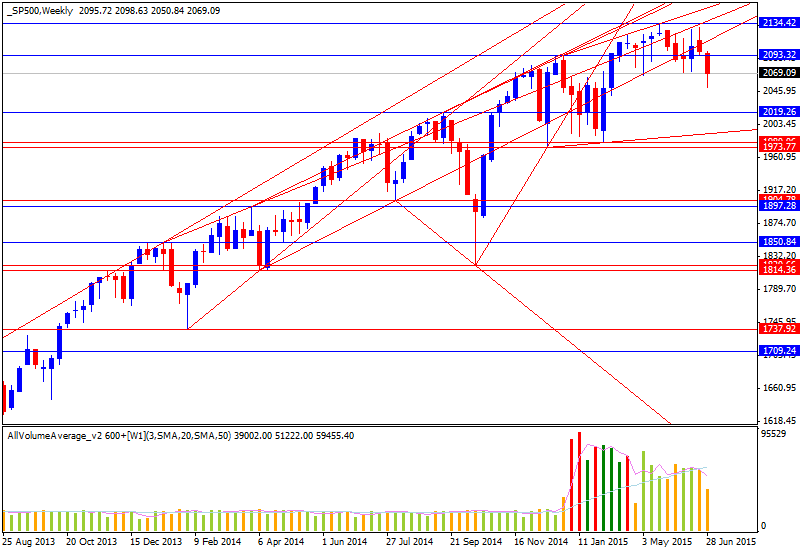
S&P 500 TECHNICAL ANALYSIS - Prices are attempting to correct higher having turned downward as expected. From here, a move above the 38.2% Fibonacci retracement at 2083.60exposes the 50% level at 2092.40.
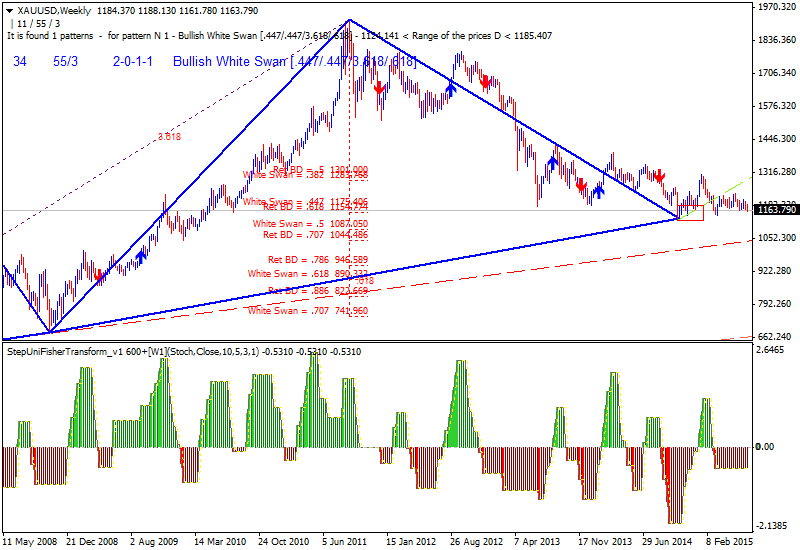
GOLD TECHNICAL ANALYSIS - Prices edged through range support, ending a period of consolidation and seemingly opening the door for deeper losses ahead. A move below the 61.8% Fibonacci expansion at 1162.64 exposes the 76.4% level at 1152.47.
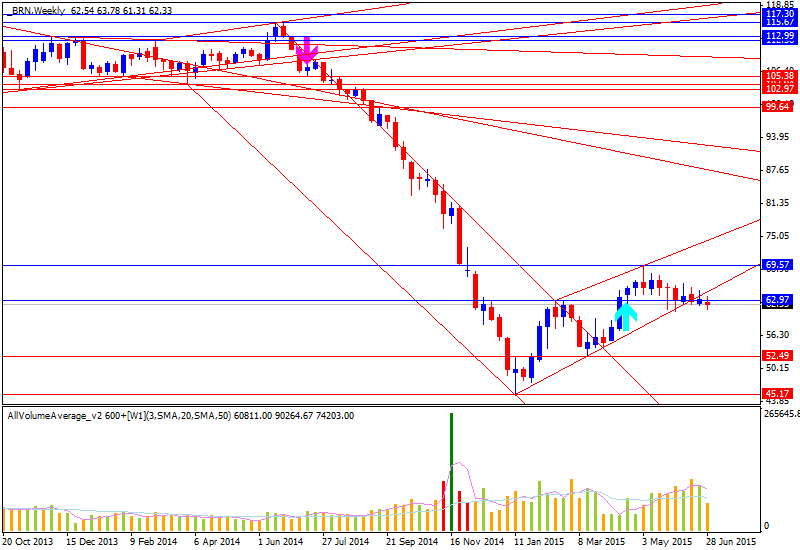
CRUDE OIL TECHNICAL ANALYSIS - Prices cleared rising trend line set from mid-January, hinting the down trend from the second half of 2014 may be resuming. A move below the 60.27-61.37 area (38.2% Fibonacci retracement, April 22 low) exposes the 50% level at 57.39.