
USDCAD Price Action Analysis - breaking 61.8% Fibo level at 1.2486 on local uptrend within the ranging bullish
10 June 2015, 12:11

0
981
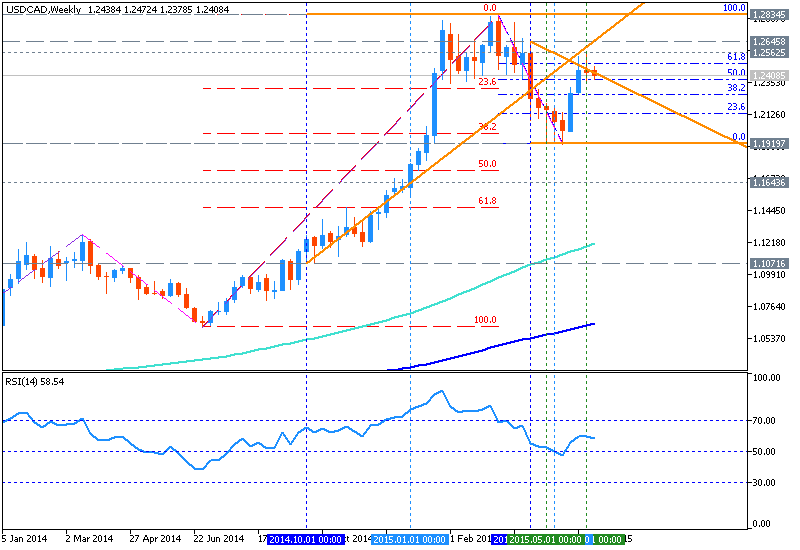
W1 price is located above 200 period SMA and above 100 period SMA for the primary bullish market condition with secondary ranging between 1.2834 resistance level and 1.1919 support level:
- the price is ranging between 1.2834 and 1.1919 levels;
- 100 period SMA is located above 200 period SMA with primary uptrend on weekly timeframe;
- the
price broke 50.0% Fibo level at 1.2377 on close
weekly bar from below to above, and stopped near 61.8% Fibo level at 1.2486 which may be next top level for the price to be going on local uptrend within this ranging bullish;
- price is breaking triangle pattern from below to above for the bullish trend to be continuing;
- if
weekly price will break 1.2834 resistance
level so the primary bullish will be continuing, otherwise the price will be ranging within the
familiar levels between 1.2834 and 1.1919;
- “The USD/CAD pair fell during the session on Monday, testing the 1.24 level yet again. By doing so, we are at the bottom of the recent consolidation area, and it now appears that we will more than likely continue to consolidate all know we recognize that we are closing towards the bottom of the candle, we which of course is a very bearish sign.”
Trend:
- H4 - ranging bullish
- D1 - ranging bullish
- W1 - ranging bullish
- MN1 - breakout (possible reversal to the primary bullish condition)


")
