The Moving Average or usual abbreviated with MA, widely used by most forex traders to determine trends. Before the trader put up a variety of indicators in metatrader forex trading application or, generally beginning and the beginning of the indicator is mounted MA. Arguably:) as a condition
How do I calculate the MA indicator? MA is calculated based on the average value of the movement of the pair. The mean values can be taken from the highest, the lowest prices, closing or opening, the median (middle). Now this requirement arguably MA indicator in an online trading application. You do not need to be hard-hard to compute, you install only (not Good).
Understand the meaning of indicators MA, relative is very easy:
* If current prices were below the line MA, then the trend is down.
* If current prices are above the line MA, then the trend is rising.
Let's look at the picture below:
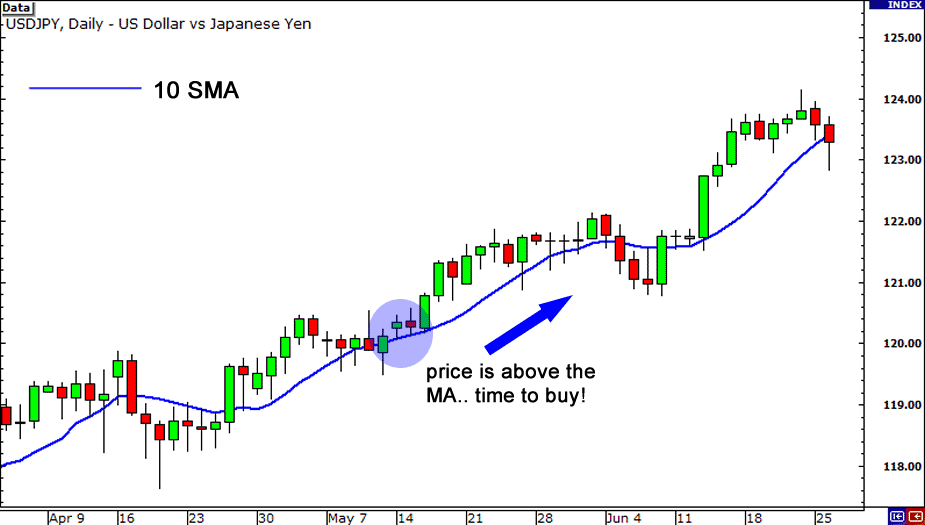
Above is an example of where trends are going up/bullish, the easy way to read it is located above the candle chart MA. The value of 10 HIGH SCHOOL means a simple moving average with the period 10, calculated from the mean value of the previous 10.
In reality no one is perfect as an indicator, sometimes there were ripples moving candle upwards/downwards trend line (against). It's what most traders will react too quickly as a sign there will be a change in the trend, but again if this was bound to happen changes? In situations where there is a fundamental antecedent news being released, it's possible that the candle will move against the trend.
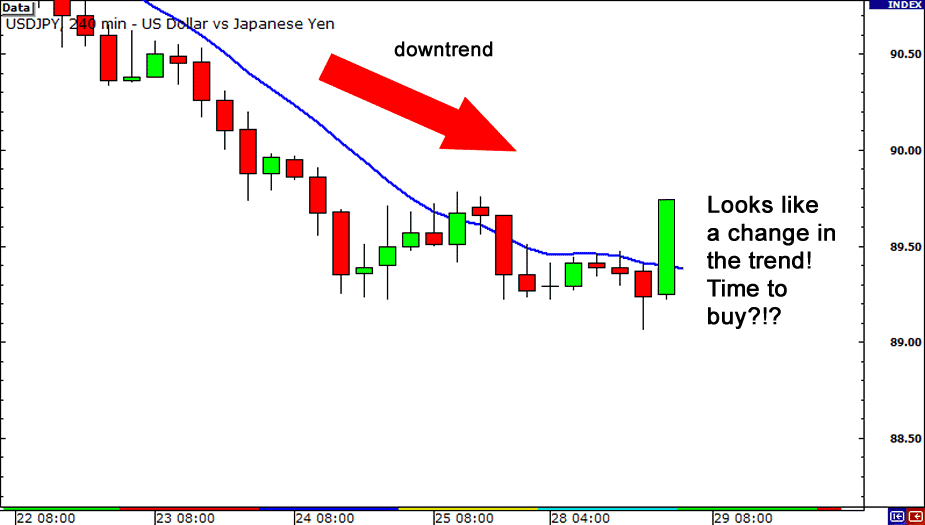
See example picture below. MA trending down.
In such a situation, should we want to struggled a little:), just look at the news just now there is news that is released, see the news weighs, how the potential of such news will change the direction of the trend?
Well let's wait awhile and see developments.
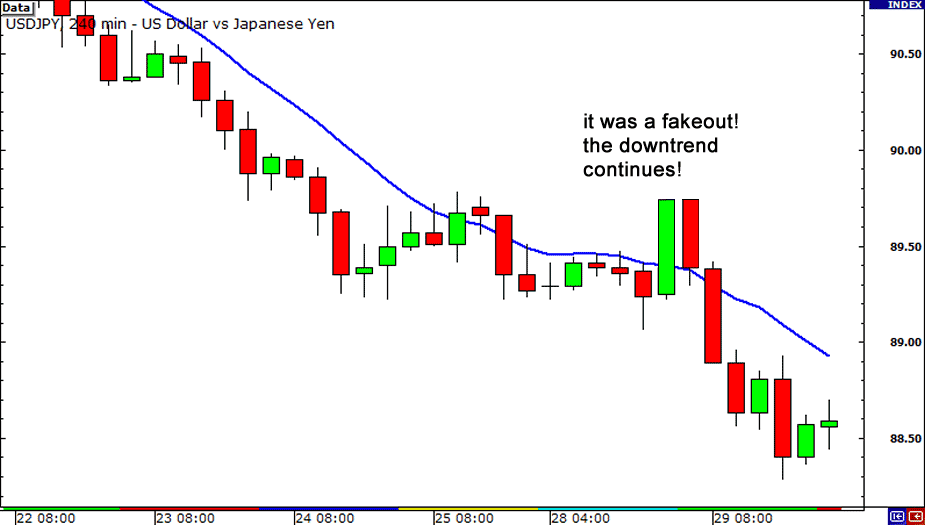
It turns out the price back down, so the reaction above is just temporary because there is news that affects movement.
A little trick for the analysis and the above conditions are, by combining a few MA at once. That is such a commonly used by traders is, use the faster and slower MA, MA. MA has a faster period < Slower MA. In accordance with the language Faster MA (smaller period) will react faster than slower MA.
And to get the predictions of a more perfect trend direction. Then:
* Trends: ride the line Faster Slower lines above MA MA
* Trending down: the line Faster Slower lines under MA MA.
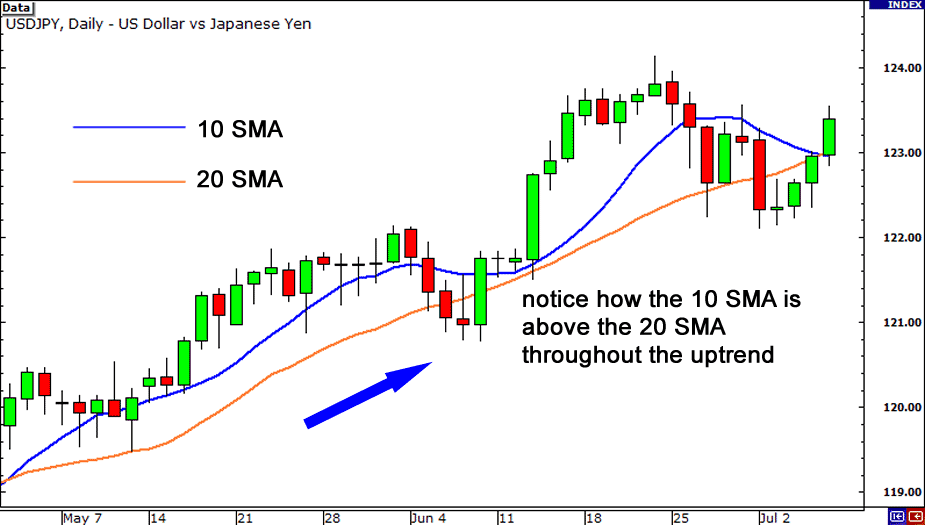
See for example the incorporation of 2 MA on the trend rising.
The blue line is faster and the time trend, MA ride is always above the orange berwarnan line (Slower MA).
By combining the 2 MA, this hope can be calm in facing the trader in case of movement of ripples candle.
Viewed from the characteristics of the MA indicator formula, then these indicators categorized in Lagging indicators (Indicator is late), why? Yes, because it is calculated based on the values that have arisen or occurred. So lagging indicators can help us determine trends, yet still inadequate for use as a mark to open a position.
Types of Indicators MA, there are 2 types of MA, who is often used:
1. HIGH SCHOOL: Simple Moving Average
2. EMA: Exponential Moving Average
The difference on the EMA, which is by pembobot on each value. Where is getting to the right the larger (exponential). The effect that occurs is the line that is formed will react faster/responsive to price changes.
For more details see the image below, a comparison of HIGH SCHOOL, and EMA lines with same period 30.
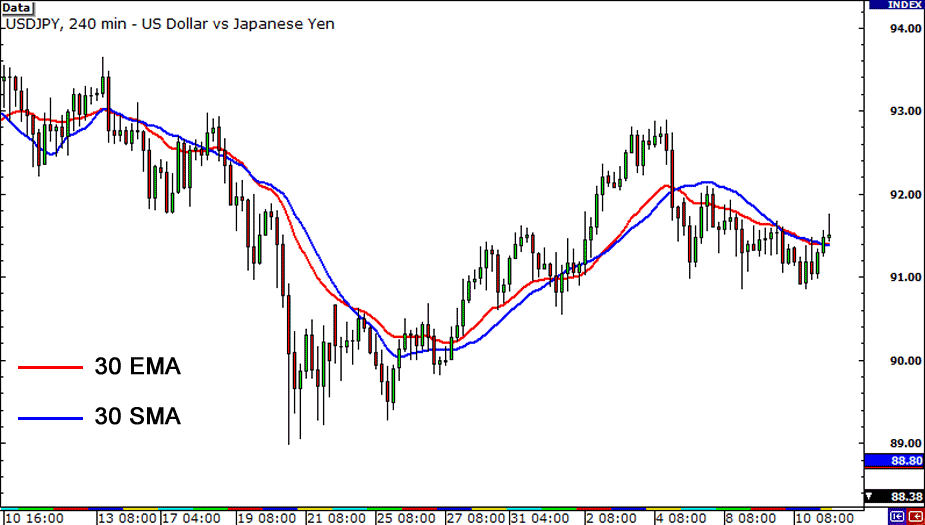
So when You put together two types of MA (SMA, EMA) in the same period, then in this EMA = 30 MA, Faster and Slower = 30 MA HIGH SCHOOL.
recomended product


")
")
![[XAUUSD]: Weekly Liquidity Activation Points (timings), June 22-26, 2026](https://c.mql5.com/6/1013/splash-preview-771790.png "[XAUUSD]: Weekly Liquidity Activation Points (timings), June 22-26, 2026")