

The Futures Mag portal asked few experts what indicators they look to in today's markets to stay successful. Here's what they said.
Moving Averages still useful
The entire psychology of ‘trend’ analysis (vs. short-term trading or
long-term valuations) rests on timeless precepts. That leaves classical
patterns and moving averages useful after so many ‘new’ or ‘ground-breaking’ analysis developments.
Balance of Power (BOP)
It measures the strength of bulls versus bears by looking at their respective abilities to push price to an extreme level. It is great not only for timing market entries but also for identifying when trends are looking exhausted. It’s also useful in trying to tell when markets are entering range-bound territory.
Technical and Fundamental Analysis
"Our indicators used to be all about America’s thirst for oil and
geopolitics disrupting supply, we’re channeling the band Kansas and have
gone past the point of no return. Now when we’re trading WTI it’s all
about U.S. production and the pace of economic growth. We used to talk
about how a $10 increase in the price of crude oil would decrease GDP by
0.5%."
Carl Larry, The President of Oil Outlooks and Opinions LLC.
Momentum, Chart Technicals, and Volume
John Caiazzo. He has over 40 years of experience at brokerage firms across the United States.
MACD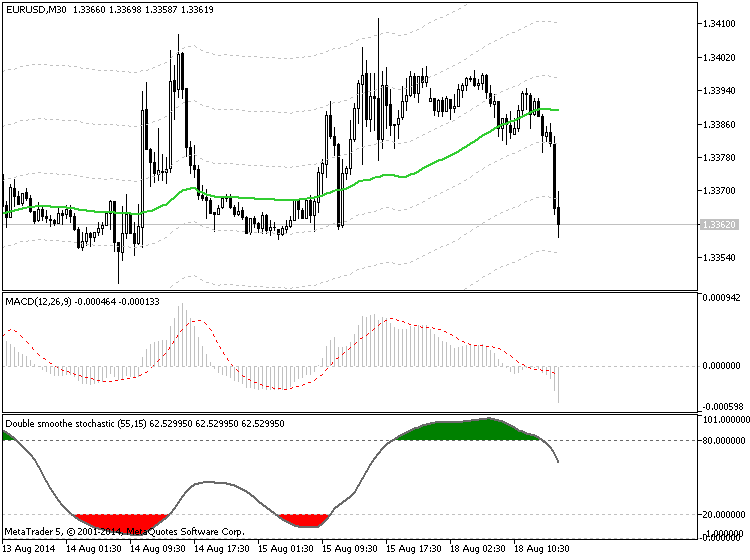
"Traders can easily modify the widely used Moving Average
Convergence-Divergence (MACD) indicator to display this information by
changing the settings for the first period to 1 and the second period to
100 (ignore the signal line). These parameters tell your trading
software to calculate the difference between the “1-period moving
average” (or the current price) and the 100-period moving average. When
this difference reaches an extreme level, it is often a signal that the
market is overbought and may be due for a pullback."
Matt Weller, the Senior Technical Analyst.


")
![[XAUUSD]: Weekly Liquidity Activation Points (timings), June 22-26, 2026](https://c.mql5.com/6/1013/splash-preview-771790.png "[XAUUSD]: Weekly Liquidity Activation Points (timings), June 22-26, 2026")
")