
Technical Analysis for US Dollar, S&P 500, Gold and Crude Oil - Possible Topping Below $70.00 for Crude Oil

US DOLLAR TECHNICAL ANALYSIS
"Prices are on pace to test April’s
swing bottom anew after a second consecutive day of heavy losses. A
daily close below the 38.2% Fibonacci expansion at 11737 exposes the 50%
level at 11688."
S&P 500 TECHNICAL ANALYSIS
"Prices are edging lower as
expected after putting in a Bearish Engulfing candlestick pattern,
warning that a double top may be taking shape. A break below the 38.2%
Fibonacci retracement at 2065.70 exposes the 50% level at 2047.10."
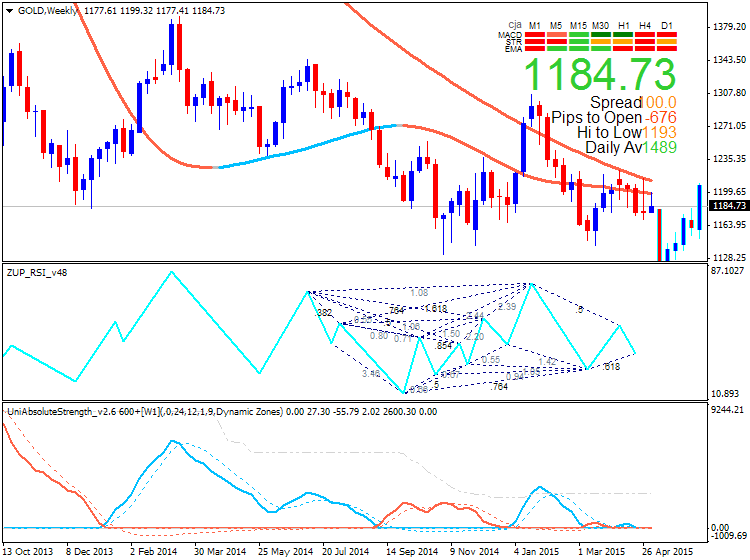
GOLD TECHNICAL ANALYSIS
"Prices continue to oscillate in a
choppy range around the $1200/oz figure. A break below range support at
1178.09 exposes the 38.2% Fibonacci expansion at 1161.16. Range
resistance remains at 1214.64."
CRUDE OIL TECHNICAL ANALYSIS
"Prices put in a Shooting Star
candlestick below resistance at 67.55, the 50% Fibonacci expansion,
hinting at ebbing upside momentum and warning that a move downward may
be ahead. A break below the 38.2% level at 66.09 exposes the 23.6% Fib
at 64.29. Alternatively, a push above the 67.55 targets the 61.8%
expansion at 69.01."


![[XAUUSD]: Weekly Liquidity Activation Points (timings), June 29 - July 3, 2026](https://c.mql5.com/6/1014/splash-preview-772062.png "[XAUUSD]: Weekly Liquidity Activation Points (timings), June 29 - July 3, 2026")
