
NZD/USD Technical Analysis: Double Bottom and Forming Retracement for Bullish
16 August 2014, 13:11

0
315
- NZD/USD Technical Strategy: Flat
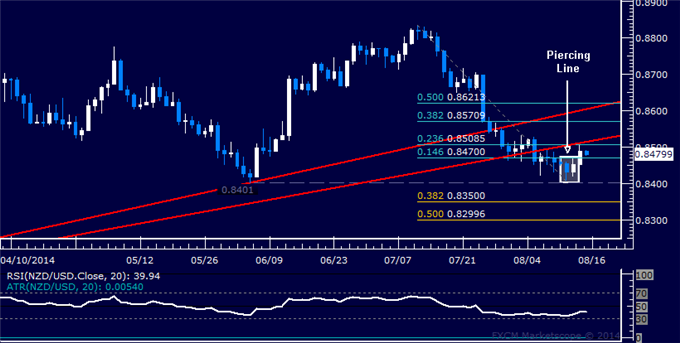
- Support: 0.8470, 0.8401, 0.8350
- Resistance:0.8509, 0.8571, 0.8621
The New Zealand Dollar edged higher against its US counterpart after
putting in a bullish Piercing Line candlestick pattern, hinting a double
bottom may be forming. Initial resistance is at 0.8509, the
intersection of a previously broken rising trend line (set from August
2013) and the 23.6% Fibonacci retracement. A break above that on a daily
closing basis exposes the 38.2% level at 0.8571. Alternatively, a turn
below the 14.6% Fib at 0.8470 opens the door for a test of the June 4
low at 0.8401.
Prices are wedged too closely between near-term support and resistance to justify taking a trade from a risk/reward perspective. We will stand aside for the time being, waiting for a more attractive setup to present itself.


")
