
Technical Analysis for US Dollar, S&P 500, Gold and Crude Oil - S&P 500 Attempts to Resume Six-Week Rising Trend

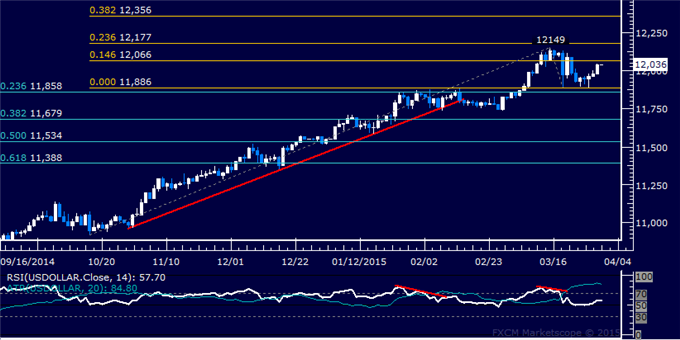
US DOLLAR TECHNICAL ANALYSIS
Prices are attempting to rebuild
upside momentum after correcting downward as expected. Near-term
resistance is at 12066, the 14.6% Fibonacci expansion, with a break
above that on a daily closing basis exposing the 12149-77 zone (23.6%
level, March 13 high).
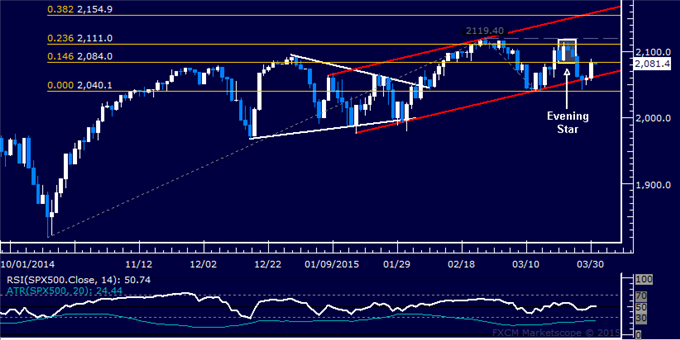
S&P 500 TECHNICAL ANALYSIS
Prices are attempting to rebuild
upside momentum after falling as expected following the appearance of a
bearish Evening Star candlestick pattern. A daily close above the 14.6%
Fibonacci expansion at 2084.00 exposes the 2111.00-19.40 area (23.6%
level, February 25 high). Alternatively, a move belowchannel floor
support at 2062.60 targets the March 12 low at 2040.10.
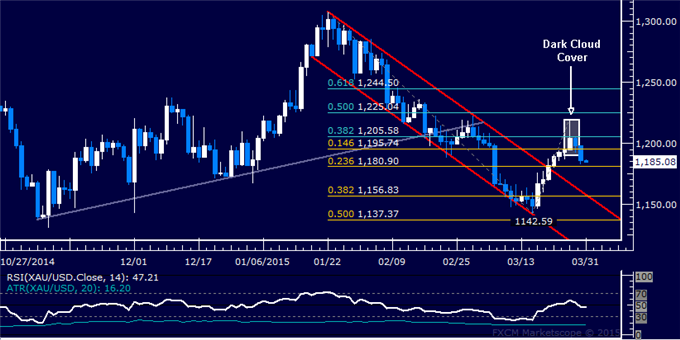
GOLD TECHNICAL ANALYSIS
Prices moved lower as expected after
putting in a bearish Dark Cloud Cover candlestick pattern. A daily close
below the 23.6% Fibonacci expansion at 1180.90 exposes the 38.2% level
at 1156.83. Alternatively, a reversal above the 14.6% expansion at
1195.74 targets the 38.2% Fib retracement at 1205.58.
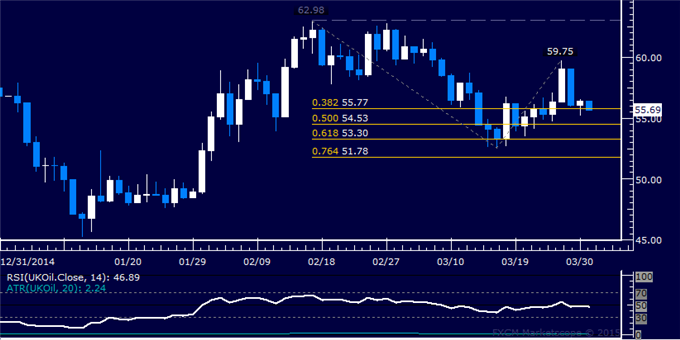
CRUDE OIL TECHNICAL ANALYSIS
Prices reversed sharply lower
after finding resistance below the $60/barrel figure. A break below the
38.2% Fibonacci expansion at 55.77 exposes the 50% level at 54.53.
Alternatively, a reversal above the March 26 high at 59.75 targets the
February 17 high at 62.98.


")
![[XAUUSD]: Weekly Liquidity Activation Points (timings), June 22-26, 2026](https://c.mql5.com/6/1013/splash-preview-771790.png "[XAUUSD]: Weekly Liquidity Activation Points (timings), June 22-26, 2026")
")