

“History repeats itself.” To take advantage of historical price patterns, in this article, fractals are instrumental in (1) forecasting the next profit-taking positions and also in (2) assessing the sustainability of a trend.
Before delving into a fractal strategy, some might wonder why fractals can be a leading indicator for live trading. The matter of fact is that fractals are lagging indicators, just as moving averages, which will be available only after the fact (post hoc). For this reason, the fractal strategy presented in this article is not using fractals formed within the most recent ten candlesticks. Instead, only price levels formulated by fractals from the very beginning to the most recent 11th candlestick will be selected as a kind of support and resistance levels to aid decision making in the fractal strategy.
B. Signals
1) Forecasting the Next Profit-Taking Positions
To keep the illustration simple at this stage, let’s assume a trader will open a buy position only if the expected profit and expected stop loss are 40 pips and 15 pips respectively.
First of all, the strategy takes the entry price as given (MA of 3 with shift 1). Then, the stop loss will be 15 pips below the entry price and the take profit will be approximately 40 pips above the entry price.
Let’s see how the strategy selects price levels.
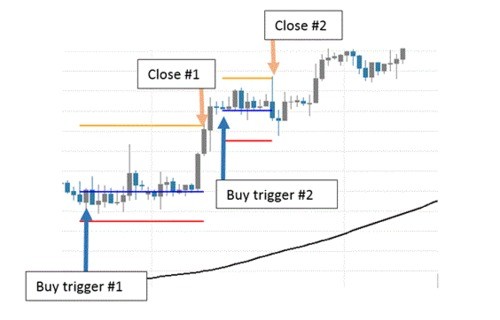
Figure 1 Trading Setup
In figure 1, the blue and the red lines indicate the entry and stop loss positions respectively. Here comes the focus of this illustration: the orange lines, indicating the desirable take-profiting levels suggested by the strategy.
Unlike a stop-loss position, which is strictly 15 pips below the entry price, a profit-taking position is not always 40 pips above the entry price since an algorithm is applied to adjust the trader’s preferred profit-taking position (entry price + 40 pips) to a more relevant price level according to a set of price levels formulated by fractals. This explains the difference in expected risk-reward ratio (distance between the blue and the red lines divided by the distance between the orange and the blue lines) of the two buy triggers in the figure 1.
Comparing the risk-reward ratio of the two orders, the first trade is more profitable and less risky than the second. Thus, the trader is likely to execute the first trade and forgo the second since the strategy suggests that the second trade is unlikely to match the trader's expectation (40 pips profit).
2) Assessing the Sustainability of the Prevailing Uptrend
Assume that the trader has been riding on an uptrend for a straight eight hours, one question springs to mind is the probability of the prevailing uptrend to continue for the next hour.
To answer this question, let’s focus on the blue lines in figure 1. One of the rationale behind the trading strategy is that the prevailing trend is going to persist unless it reverses itself. Based on this rationale, the strategy will continuously test whether the previous expected profit-taking level is attained. If an uptrend were to hold, the market would have no difficulty in reaching a higher level. Once an expected profit-taking level was reached, the strategy would generate another buy signal and issue a new challenge to the market – another expected profit-taking level. The process continues until the market fails to rise to the challenge. In that situation, no new buy signal will be generated. So, every series of buy signals reveals the rhythm of a trend development.
In gauging the sustainability of a trend, the keys are the rhythm of series of buy signals together with qualitative analysis.
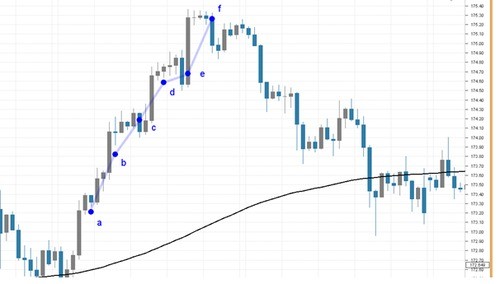
Figure 2 Trend Analysis
In figure 2, each blue dot represents one buy signal. To analyze the duration and the extent between the blue dots, let’s turn to the data below.
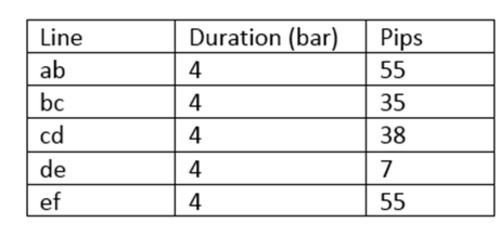
From point "a" to point "d", the uptrend is likely to be sustainable because there is no abrupt change in the slope along the line segment. However, from point "d" to "e", the rally slows down and that can be interpreted as a healthy intermediate correction or as an early signal of reversal. From point "e" to point "f", the market regains its momentum but, to err on the side of caution, the steepness of line "ef" can be too steep to sustain the uptrend.
C. Backtesting: Fractal Strategy In Action
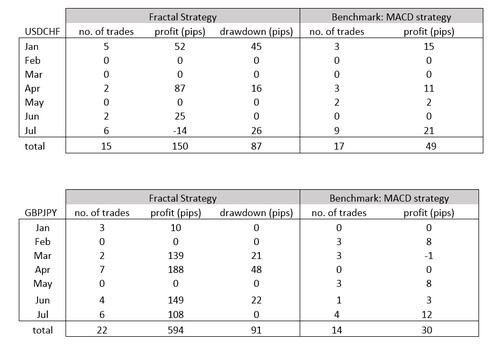
After discussing the mechanics of incorporating fractals into a buy strategy, we now turn to some backtesting results to get a glimpse of the strategy’s performance over the first half of this year (January to July 2014) on currency pairs USDCHF and GBPJPY.
Note:
1. Both strategies executed only buy orders on a 4-hour chart.
2. The benchmark strategy will buy only when 60 MA crosses 180 MA.
D. Evaluation
The backtesting exercise above is rather rudimentary but it serves to justify the usefulness of the fractal strategy, especially when considering the size of the drawdown relative to the size of profit realized.
Before closing, I would like to relax two assumptions to address the practicality of the strategy.
First, the assumption of 40-pip take profit and 15-pip stop loss expectation is unrealistic in live trading. To revise this assumption, it is sensible to determine the profit-taking and stop-loss levels by taking into account the nature of currency pairs as well as the current market sentiment. Statistical analysis is definitely the most obvious direction to go.
Second, it is too optimistic to assume that the algorithm applied can always select the most significant price levels derived from hundreds and thousands of fractals. As not all fractals are created equal, re-weighting those selected price levels by traders' hand-drawn support and resistance levels is one promising way to improve the strategy. Above all, a trader’s instinct is probably the best guidance system to complete a trading setup.


 & AMD Framework")

")