Technical Analysis for CRUDE OIL, GOLD, US DOLLAR INDEX and S&P 500

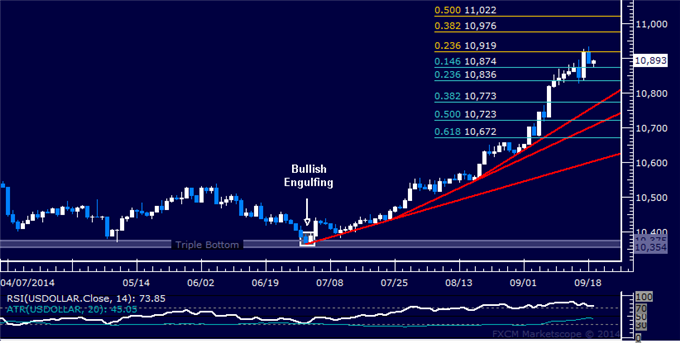
US DOLLAR TECHNICAL ANALYSIS
Prices corrected modestly lower after
hitting the highest level in 14 months against its top counterparts.A
daily close below the 14.6% Fibonacci retracementat 10874 exposes the
23.6% level at 10836. Alternatively, a turn above the 23.6% Fib
expansion at 10919 clears the way for a test of the 38.2% threshold at
10976.
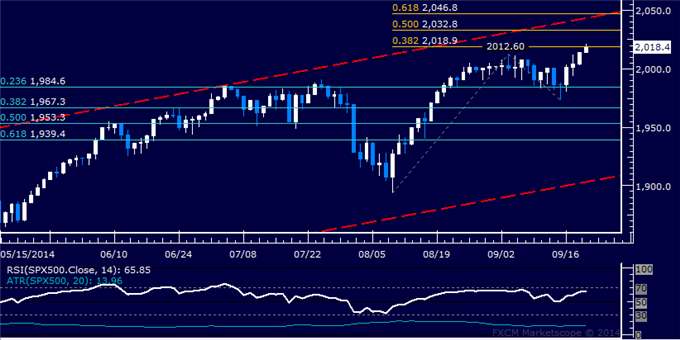
S&P 500 TECHNICAL ANALYSIS
Prices are testing resistance in the
2012.60-18.90 area marked by the September 3 high and the 38.2%
Fibonacci expansion. A break above this barrier on a daily closing basis
exposes the 50% level at 2032.80. Alternatively, a reversal below the
23.6% Fib retracement at 1984.60 targets the 38.2% threshold at 1967.30.
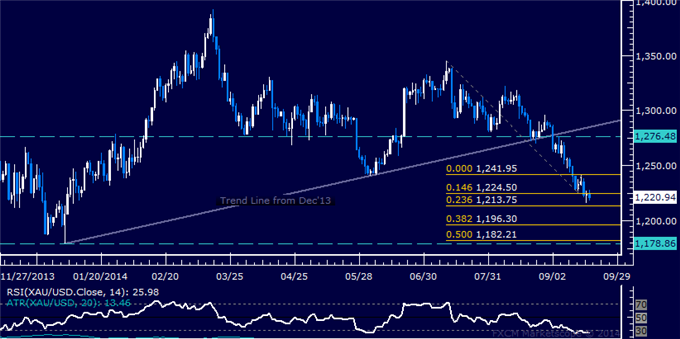
GOLD TECHNICAL ANALYSIS
Prices broke downward, with sellers now aiming
to challenge the 23.6% Fibonacci expansion at 1213.75. A break below
this barrier on a daily closing basis exposes the 38.2% level at
1196.30. Alternatively, a reversal above the 14.6% Fib at 1224.50
targets the September 16 high at 1241.95
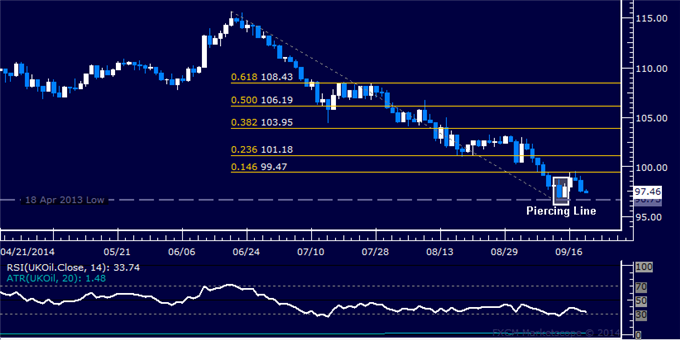
CRUDE OIL TECHNICAL ANALYSIS
Prices are edging higher as expected
after putting in a bullish Piercing Line candlestick pattern above
support at 96.73, the mid-April 2013 low. Near-term resistance is at
99.47, the 14.6% Fibonacci retracement, with a break above that on a
daily closing basis exposing the 23.6% level at 101.18.