Technical Analysis for UD Dollar, S&P 500, Gold and Cruide Oil - S&P 500 Still Waiting for Clear-Cut Directional Cues

US DOLLAR TECHNICAL ANALYSIS
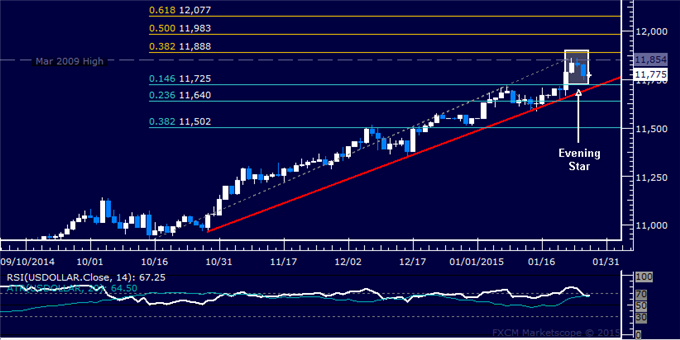
Prices may be preparing to decline
after prices put in a bearish Evening Star candlestick pattern.
Near-term support is at 11725, the intersection of the 14.6% Fibonacci
retracement and a rising trend line, with a break below that on a daily
closing basis exposing the 23.6% level at 11640.
S&P 500 TECHNICAL ANALYSIS
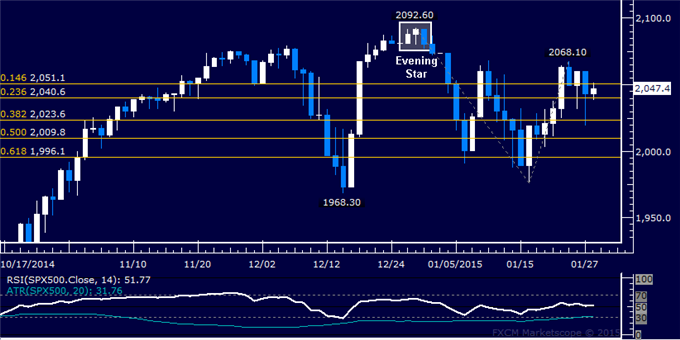
Prices declined as expected
after putting in a bearish Evening Star candlestick pattern. A daily
close below the 23.6% Fibonacci expansion at 2040.60 exposes the 38.2%
level at 2023.60.
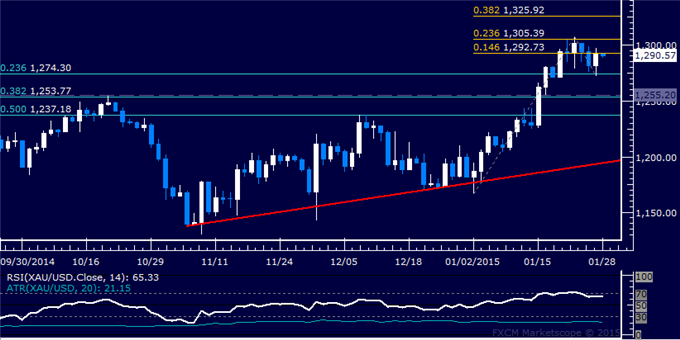
GOLD TECHNICAL ANALYSIS – Prices paused to consolidate after
finding resistance above the $1300/oz figure. A daily close below the
23.6% Fibonacci retracement at 1274.30 exposes the 38.2% level at
1253.77. Alternatively, a push above the 14.6% Fib expansion at 1292.73
targets the 23.6% threshold at 1305.39.
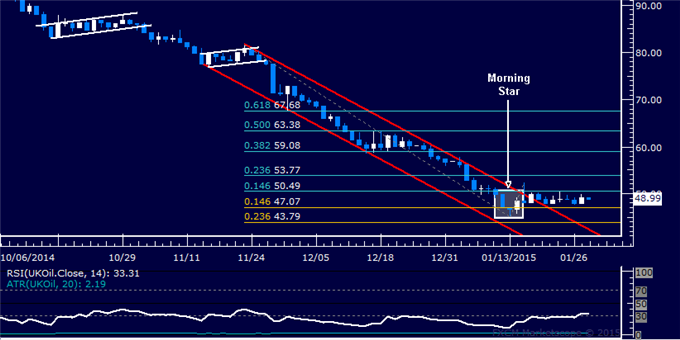
CRUDE OIL TECHNICAL ANALYSIS – Prices are stalling having attempted to recover as expected. A daily close above the 14.6% Fibonacci retracement at 50.49 exposes the 23.6% level at 53.77. Alternatively, a reversal below the 14.6% Fib expansion at 47.07 targets the 23.6% threshold at 43.79.