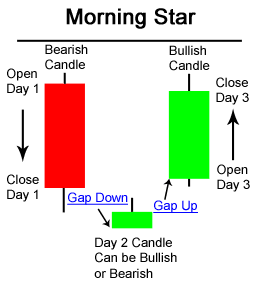
The Morning Star Pattern is a bullish reversal pattern, usually occuring at the bottom of a downtrend. The pattern consists of three candlesticks:
- Large Bearish Candle (Day 1)
- Small Bullish or Bearish Candle (Day 2)
- Large Bullish Candle (Day 3)

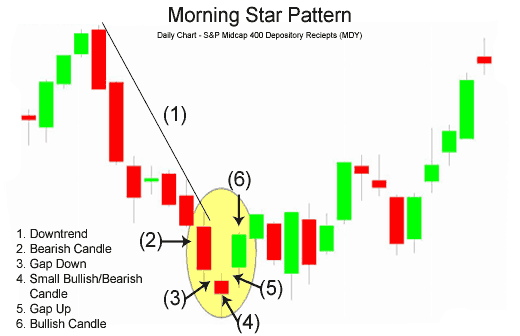
The chart below of the S&P 400 Midcap exchange traded fund (MDY) shows an example a Morning Star bullish reversal pattern that occured at the end of a downtrend:

Day 1 of the Morning Star pattern for the Midcap 400 (MDY) chart above was a strong bearish red candle. Day 2 continued Day 1's bearish sentiment by gapping down. However, Day 2 was a Doji, which is a candlestick signifying indecision. Bears were unable to continue the large decreases of the previous day; they were only able to close slightly lower than the open.
Day 3 began with a bullish gap up. The bulls then took hold of the Midcap 400 exchange traded fund for the entire day. Also, Day 3 broke above the downward trendline that had served as resistance for MDY for the past week and a half. Both the trendline break and the classic Morning Star pattern gave traders a signal to go long and buy the Midcap 400 exchange traded fund.
The Morning Star pattern is a very powerful three candlestick bullish reversal pattern. The bearish equivalent of the Morning Star is the Evening Star pattern


