

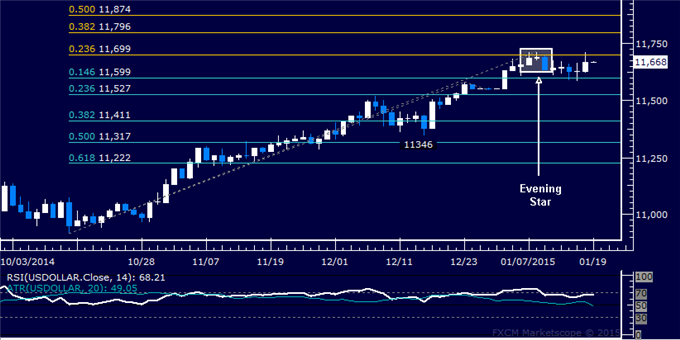
US DOLLAR TECHNICAL ANALYSIS
Prices are struggling with
downside follow-through having topped as expected. A daily close below
the 14.6% Fibonacci retracementat 11599 exposes the 23.6% level at
11527.
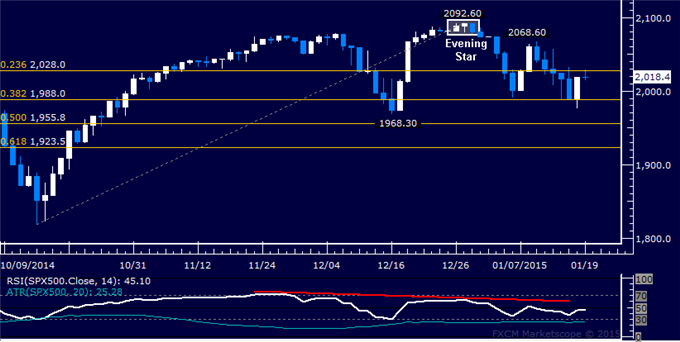
S&P 500 TECHNICAL ANALYSIS
Prices declined as expected
after putting in a bearish Evening Star candlestick pattern. A daily
close below the 38.2% Fibonacci retracement at 1988.00 exposes the 50%
level at 1955.80.
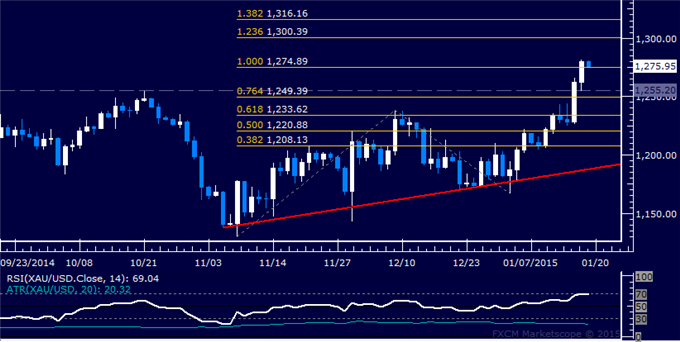
GOLD TECHNICAL ANALYSIS
Prices appear poised to continue higher
after rising to the strongest level in over four months. A daily close
above the 123.6% Fibonacci expansion at 1300.39 exposes the 138.2% level
at 1316.16. Alternatively, a turn back below the 100% Fib at 1274.89
targets the 1249.39-55.20 area marked by the 76.4% expansion and the
October 21 high.
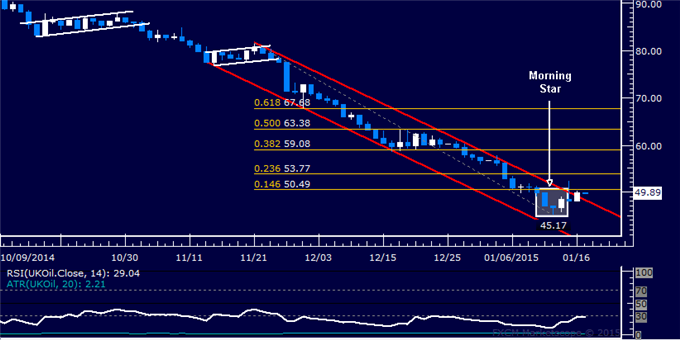
CRUDE OIL TECHNICAL ANALYSIS
Prices are attempting to recover
as expected. A daily close above the 14.6% Fibonacci retracement at
50.49 exposes the 23.6% level at 53.77. Alternatively, a reversal below
channel top resistance-turned-support at 48.25 targets the January 13
low at 45.17.


")

")