
Funded Titan: +$482.79 on a live account since June 17 — live trading results and a comparison with the backtester

In this article, I will take a detailed look at the first results of the Funded Titan Expert Advisor on a real trading account, where it has been running since June 17, 2026.
At the time the statistics were recorded, the profit from closed trades reached +$482.79, while the account balance increased from $10,001.86 to $10,484.65.
Instead of publishing only one final number, I will show the actual trading history, the Balance and Equity values, and compare the real account results with a Funded Titan backtest performed on a similar market period. This format makes it possible to evaluate not only the final profit, but also how the EA handles profitable and losing positions, what drawdown occurs while trades are open, and how closely the Strategy Tester results correspond to real trading.
All trades were opened on Funded Titan’s primary trading instrument, EURUSD, using the H1 timeframe.
You can also evaluate the historical performance of Funded Titan before purchasing it by running the EA in the MetaTrader 5 Strategy Tester. A demo version is available on the official product page in the MQL5 Market.
Funded Titan MT5 — product page and demo version
A strong result in the Strategy Tester still does not answer the most important question: what happens after the Expert Advisor is launched on a real trading account?
Historical testing is performed in a controlled environment. Real trading introduces actual spreads, broker execution, slippage, changing volatility, and differences in the price feed. For this reason, an EA should not be evaluated only through long-term backtests. It is also important to observe how the algorithm behaves after it is connected to a real account.
On June 17, 2026, I launched Funded Titan on a separate account for EURUSD trading on the H1 timeframe.
At the time this article was prepared, the result from closed positions was +$482.79, while the balance had increased from $10,001.86 to $10,484.65.
This is the first checkpoint in the observation of Funded Titan under real market conditions.
What the real account showed
Main figures at the time the result was recorded:
Start of trading: June 17, 2026
Trading instrument: EURUSD
Working timeframe: H1
Initial balance: $10,001.86
Current balance: $10,484.65
Profit from closed positions: +$482.79

Fig. 1. Funded Titan trading on a real EURUSD H1 account from June 17 to July 8, 2026.
Why the result cannot be explained by one lucky trade
The account history includes both buy and sell positions, different trade volumes, predefined Stop Loss and Take Profit levels, and both profitable and losing outcomes.
The +$482.79 result was generated through a sequence of trades opened on different trading days and under different market conditions.
The period following the largest losing position is particularly important. The EA did not attempt to recover the loss immediately by opening an uncontrolled number of new trades. Instead, it continued to wait for the next valid conditions and opened new positions only when the strategy generated another signal.
Funded Titan does not use martingale or a grid trading system. Every position is opened with predefined risk parameters and protective levels.
What the Strategy Tester showed
I also tested Funded Titan on historical data covering the market period from June 17 to July 3.
The initial deposit in the Strategy Tester was $10,000.
Main test results:
Initial deposit: $10,000
Total net profit: +$982.94
Gross profit: $1,590.46
Gross loss: −$607.52
Profit Factor: 2.62
Total trades: 14
Profitable trades: 13 out of 14
Maximum balance drawdown: 4.34%
Maximum equity drawdown: 8.45%
History quality: 100%
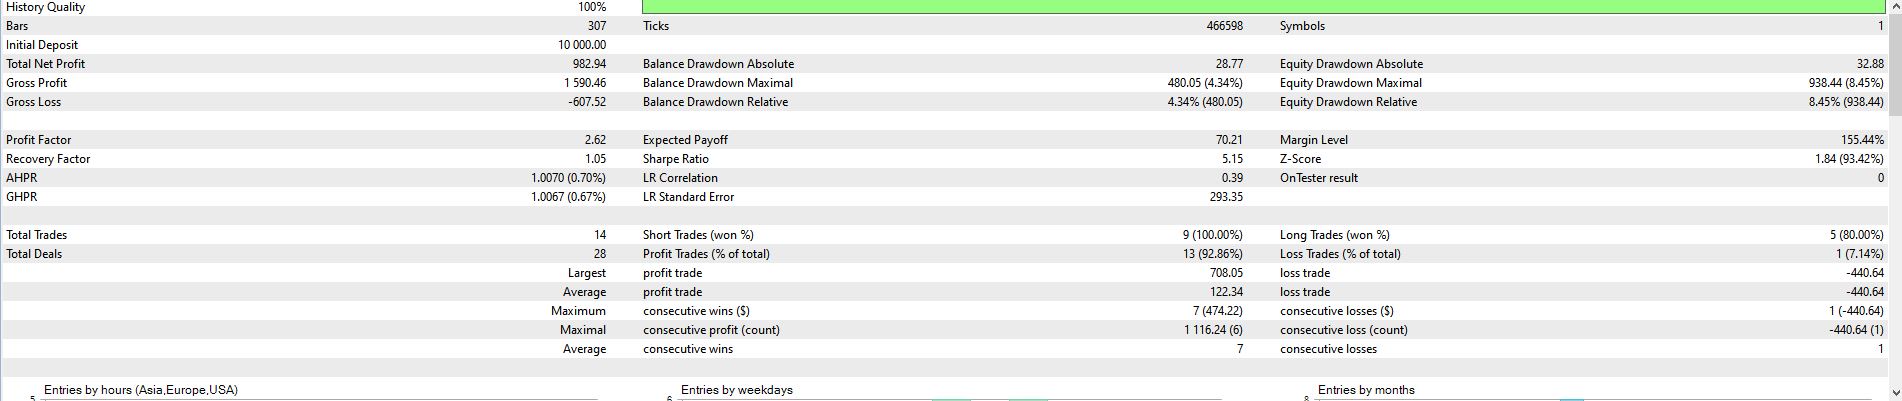
Fig. 2. Balance and Equity chart in the MetaTrader 5 Strategy Tester.
The chart shows the changes in Balance and Equity separately. The blue line represents the result of closed positions, while the green line shows changes in Equity while trades were still open.
Sharp movements in the green line show that even when the final result was positive, some positions experienced noticeable floating drawdown. This is why a test should not be evaluated only by its final profit.

Fig. 3. Detailed Funded Titan Strategy Tester report for the selected period.
What the comparison between the real account and the Strategy Tester shows
The test results in this article are not presented as separate promotional statistics. They are used as an additional way to study the same algorithm in greater detail.
The real account shows the most important point: Funded Titan is opening and closing trades using actual broker quotes and real order execution. However, a standard account history mainly shows the final result of each position and does not always make it possible to see what happened to Equity while the trade was still open.
The Strategy Tester adds this missing context. During the selected period, Funded Titan opened 14 trades and produced the following results:
Net profit — +$982.94
Profit Factor — 2.62
Profitable trades — 92.86%
Maximum balance drawdown — 4.34%
Maximum equity drawdown — 8.45%
History quality — 100%
The difference between balance drawdown and equity drawdown is especially important. Balance reflects only closed positions, while Equity shows the current account value including open trades. The tester chart therefore makes it possible to evaluate not only the final result, but also the load placed on the account while positions were open.
This is the main value of combining both types of analysis:
The real account confirms actual order execution, while the Strategy Tester provides a deeper view of how the strategy behaves inside its trades.
This approach provides a more complete picture of Funded Titan than a single profit screenshot or an isolated tester report.
A result you can verify independently
The main advantage of the published data is that readers do not have to rely only on my conclusions.
A demo version of Funded Titan is available on the product page. It can be launched in the MetaTrader 5 Strategy Tester, allowing you to select your own historical period and verify:
- which trades the algorithm opened;
- how Balance and Equity changed;
- the maximum drawdown;
- how the EA worked in visual mode;
- how the result changes with different risk settings;
- how the results differ when tested with quotes from a specific broker.
The real account therefore shows the current practical performance of Funded Titan, while the demo version allows every user to study the EA independently before purchasing it.
Funded Titan MT5 — product page and demo version



![[iVISTscalp5]: XAUUSD. Forecast First. Market Reaction Afterwards](https://c.mql5.com/6/1035/splash-preview-777232.png "[iVISTscalp5]: XAUUSD. Forecast First. Market Reaction Afterwards")
