

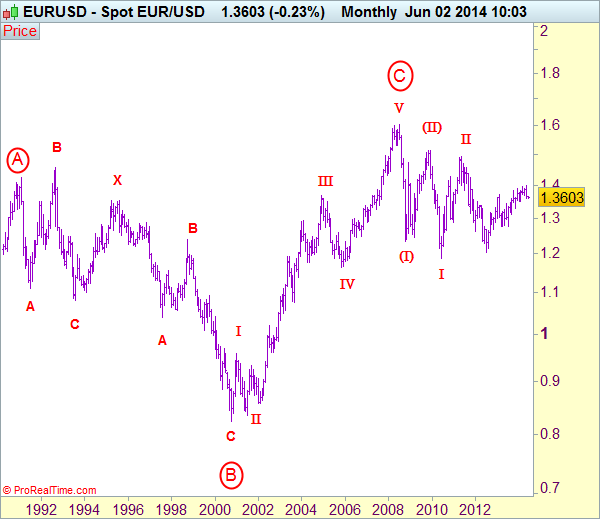
EUR/USD: Wave (B) ended at 1.5145 and wave I of (C) ended at 1.1876
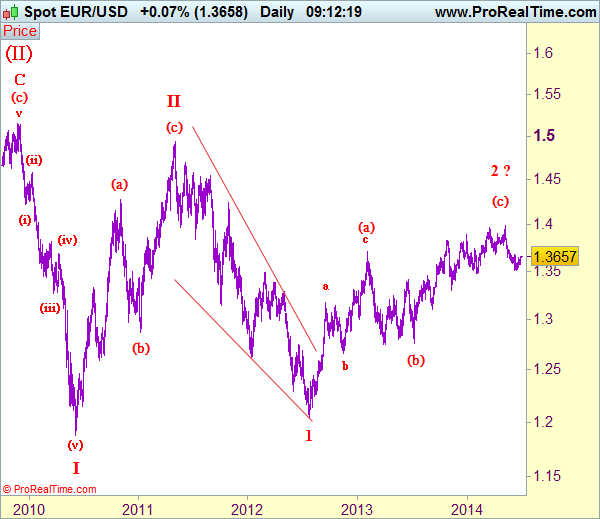
As the single currency has continued to edge higher after holding above support at 1.3564, retaining our view that further consolidation above this level would be seen and another corrective bounce to 1.3677 and possibly 1.3700 cannot be ruled out, however, reckon resistance at 1.3734 would limit upside and bring another decline later. A break of said support at 1.3564 would bring retest of recent low at 1.3503, below there would extend recent selloff from 1.3993 top for a test of previous support at 1.3477, a daily close below this level would add credence to our view that the entire rise from 1.2042 (2012 low) has ended at 1.3993 and bring correction of recent upmove to 1.3390-00 but reckon support at 1.3295 should hold on first testing.
Our preferred count on the daily chart remains that a wave (II) from 1.2329 ended at 1.5145 with A-leg ended at 1.4720, followed by wave B at 1.2457, the wave C from there was also a 3 legged move and is labeled as (a): 1.3739, (b): 1.2885, the wave iii of the 5-waver (c) from 1.2885 has ended at 1.4339 and wave iv is a triangle ended at 1.3878 and wave v formed a top at 1.5145. The decline from there is a 5-waver (C) with minor wave (i) of I of (C) ended at 1.4218 with wave (ii) ended at 1.4580, wave (iii) ended at 1.3267 and wave (iv) ended at 1.3692 and wave (v) ended at 1.1876, this is also the low of wave I of (C) and wave II has possibly ended at 1.4940, hence wave III is now in progress with a diagonal wave 1 ended at 1.2042, wave 2 already met indicated retracement target at 1.3833-35 (61.8% Fibonacci retracement of
On the upside, a daily close above resistance at 1.3734 would suggest first leg of decline from 1.3993 top has ended and risk a stronger rebound to 1.3800-10 and possibly to 1.3850-60 but upside should be limited to 1.3900 and bring another decline later. Only break of 1.3996-1.4000 (last month's high and psychological resistance) would signal the rise from 1.12042 (2012 low) has resumed in wave (c) of larger degree wave 2 for gain to 1.4045-50 (50% projection of 1.2755-1.3894 measuring from 1.3477) but reckon upside would be limited to 1.4140-50 and 1.4233-48 (1.618 times projection of 1.2755-1.3453 measuring from 1.3105 and previous chart resistance) should hold from here, bring another strong retreat later.
Recommendation: Sell at 1.3730 for 1.3530 with stop above 1.3830.
Euro's long-term uptrend started from 0.8228 (26 Oct 2000) with an impulsive structure. The rise from 0.8228 to 0.9593 (5 Jan 2001) is labeled as wave I, the retreat to 0.8352 (6 Jul 2001) is wave II and the rally to 1.3670 (31 Dec 2004) is wave III. Wave IV from there ended at 1.1640 (15 Nov 2005), the subsequent upmove to 1.6040 (July 15, 2008) is treated as wave V, the major selloff from the record high of 1.6040 to 1.2329 (October 27, 2008) signals a reversal has taken place with (I) leg ended at 1.2329 and once (II) ended at 1.5145, wave (III) itself is an extended move with I: 1.1876 and complex wave II should be limited to 1.5145, bring wave III decline later.


")

")