

I really like this chart setup because it works quite well. In fact, it works really well actually if you can identify it properly. Even if you just scroll back and analyze the historical data available, you will see that it is generally quite a reliable chart pattern. If it fails, you know immediately and can close out your positions and take the other side.
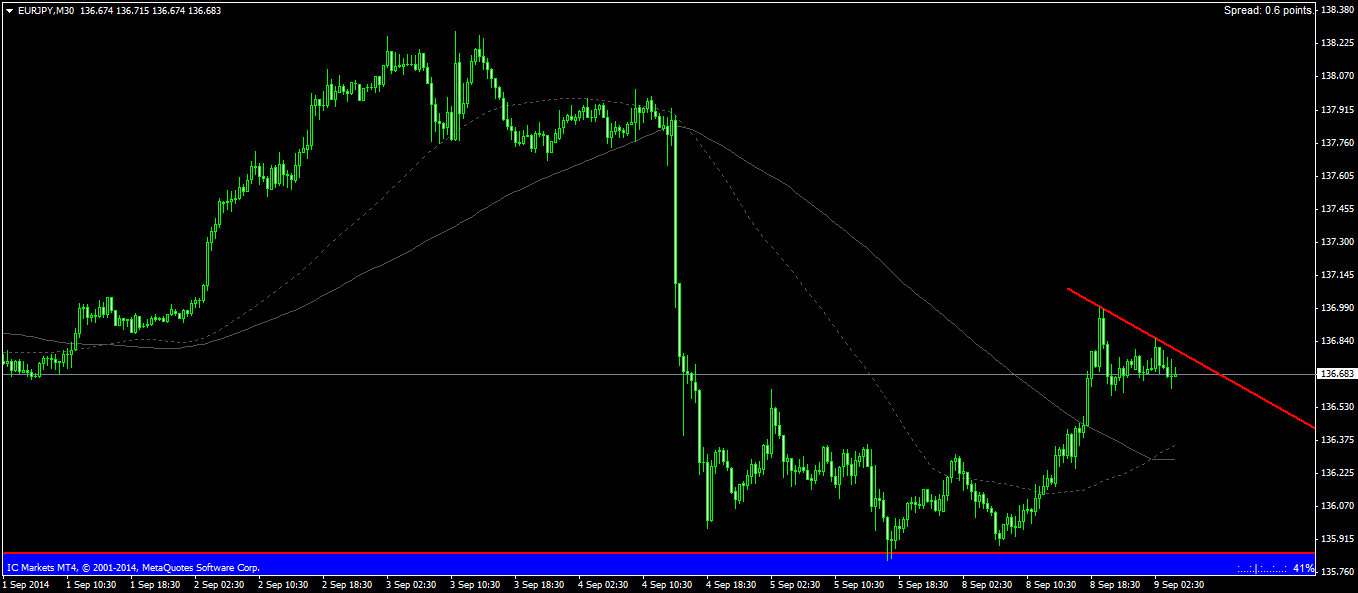
The lower high fractal is similar to the double top except a slanted trend line is drawn. This is a good wave analysis setup as well. The initial fall and uptick shows the early sellers and some of them closing out their trades. The second wave of selling begins and usually results in a much bigger price movement. Generally, we would want to catch the second wave because a third wave may not come. If a third wave does come, it won't be nearly as strong and so will not be worth trading in terms of the risk to reward ratio.
Keep in mind that a support line can be drawn as well at 136.610315. If you have it drawn, then you will notice the triangle/ wedge formation. This is a consolidation only to push the price higher. The bias here is short, but you can easily reverse the position if it proves otherwise.


 Market Outlook – Monday Opening (11 May 2026)")