

Candlesticks are a great tool to help you see sentiment in real-time.
However, there is something deeper than what the candlestick is showing
you. That something deeper is your fear of being on the cusp of a
reversal against your position. Therefore, a false signal of
Candlesticks can be costly where as Heikin-Ashi would have likely kept
you in the trade as this article will explain.
Why Mess With a Good Thing?
The short answer to this question is that there is a lot of noise with
candle to candle price action which can make some candlestick signals
misleading. How they are misleading is when you get more noise than
signals. Even though candlesticks can help you to find & confirm higher-probability entries when a reversal is shown by other tools or techniques, traders need to be aware of a potential false signal.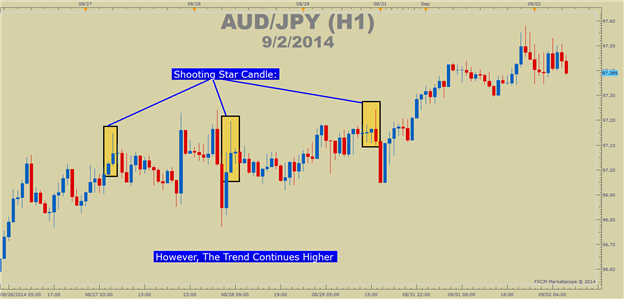
Heiken-Ashi also simplifies the process of visualized trading. If you’re
familiar with Candlesticks, you may be aware that there are over a
hundred documented Candlestick patterns. This means that not only is it
difficult to learn all candlestick patterns, but as you can see above,
there not always reliable. The highlighted boxes above are to highlight
reversal signals, known as Shooting Stars that did not result in a true
market turn and could be seen as noise vs. a true signal.
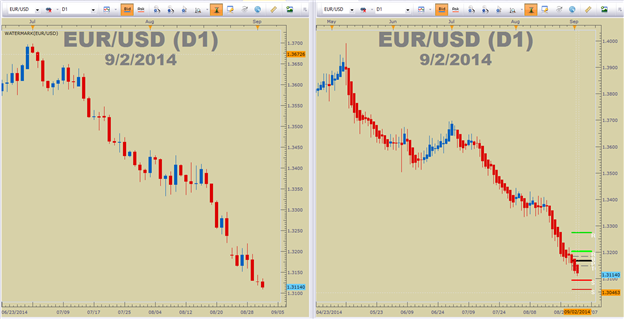
The Purpose of Heiken-Ashi
Heiken-Ashi is a visualized balanced candle so that you can filter price
of the current move for the overall trend. Heiken-Ashi is sometimes
known as an average candle to replace or confirm candlestick patterns.
As you can see from the calculation, Heiken-Ashi averages out the prior
candle to build a bias for the overall trend continuation and the
current candle.
Heiken-Ashi Formula
Close = (Open+High+Low+Close)/4
Open = [Open (previous bar) + Close (previous bar)]/2
High = Max (High,Open,Close)
Low = Min (Low,Open, Close)
By looking at the calculations, you’ll be able to see that Heiken-Ashi
is a technique which looks at the average price of a candle and uses
that to plot the next candle’s open. Because the current candle is
plotted based on the prior candle’s average, you’ll notice a sequence of
same-colored candle bodies to show a clean trend with longer bodies
& candlewicks in the direction of the trend showing you strong
trends.
Trading With New Vision
Heiken-Ashi doesn’t look for traditional candlestick patterns. Rather,
when using Heiken-Ashi, you’re looking for a strong trend to stay in
while always managing risk with a trailing stop. When the bodies get
weaker / smaller or begin to change color, then a reversal and / or
correction is on hand, it’s time to step aside from the trade as the
future is increasingly uncertain in respect to the prior trend you were
trading.
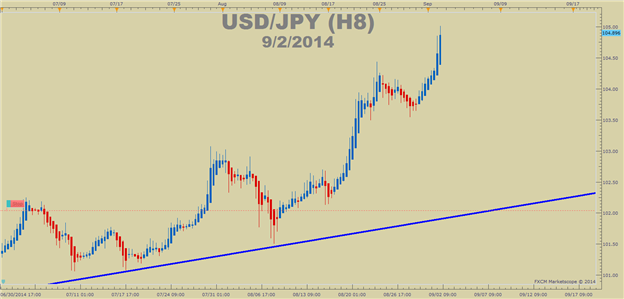
The strongest trends are displayed with a shaved Heiken-Ashi candle. If
you are trading an uptrend with Heiken-Ashi applied to your charts, and
the current candle shows no candlewick to the downside, the trend is
very strong and it is best to stay in the trend until either a red
candle appears which my preference is or a bottom candlewick forms. This
form of trade management provides an active and intelligent trailing
stop so that you’re only exiting on a likely consolidation that can chew
up time or a reversal is on hand.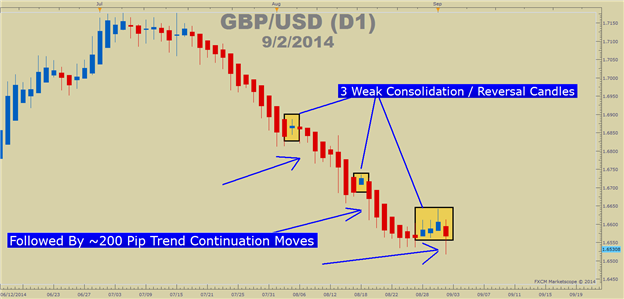
Heiken-Ashi allows you to “trick” your eye to staying in the strong
trends that can throw off weak or false reversal signals. This trick is
based on averaging the prior candle so that the current price action is
only filtered through the prior candle as opposed through the time of
the prior candle. If you have trouble jumping out of a trend well before
it’s done, Heiken-Ashi could be a helpful indicator for you.


 & AMD Framework")
")