
Video Manual and Free to Download: Ichimoku - Invalid Kumo Breakouts
5 December 2014, 03:11

0
1 286
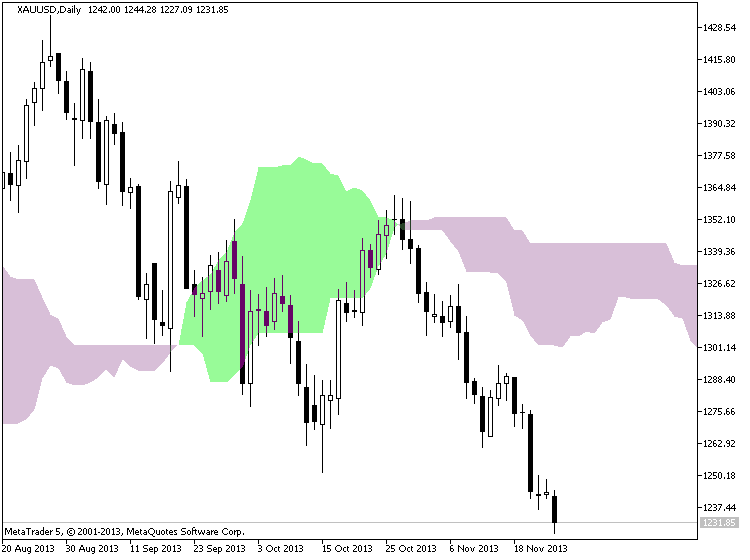
Here's a look at a few Kumo Breakouts and why they are not valid breakouts.
==============
Ichimoku threads/posts on mql5.com forum
- The theory of the signals
- Ichimoku alert indicator with arrows
- Ichimoku alert indicator improved : warning alert mode was fixed and autosettings feature was added

============
Ichimoku indicator description
- Tenkan Sen - moving average of the highest high and lowest low over the last 9 trading days. (Highest high + Lowest low) / 2 over the last 9 trading days
- Kijun Sen - moving average of the highest high and lowest low over the last 26 trading days. (Highest high + Lowest low) / 2 over the last 26 trading days.
- Senkou Span A - the average of the Tenkan Sen and Kijun Sen, plotted 26 days ahead. (Tenkan Sen + Kijun Sen) / 2 plotted 26 days ahead
- Senkou Span B
- the average of the highest high and lowest low over the last 52 days,
plotted 26 days ahead. (Highest high + Lowest low) / 2 over the last 52
trading days plotted 26 days ahead.
- Chikou Span - the closing price plotted 26 days behind.
=============
Tenkan Sen / Kijun Sen Cross
The Tenkan Sen / Kijun Sen Cross signal occurs when the Tenkan Sen (Turning line) crosses the Kijun Sen (Standard line).
A bullish signal occurs when the Tenkan Sen crosses from below to above the Kijun Sen
- A weak bullish signal occurs when the cross is below the Kumo.
- A neutral bullish signal occurs when the cross is inside the Kumo.
- A strong bullish signal occurs when the cross is above the Kumo.
- A weak bearish signal occurs when the cross is above the Kumo.
- A neutral bearish signal occurs when the cross is inside the Kumo.
- A strong bearish signal occurs when the cross is below the Kumo.
Kijun Sen Cross
The Kijun Sen Cross signal occurs when the price crosses the Kijun Sen (Standard line).
A bullish signal occurs when the price crosses from below to above the Kijun Sen
- A weak bullish signal occurs when the cross is below the Kumo.
- A neutral bullish signal occurs when the cross is inside the Kumo.
- A strong bullish signal occurs when the cross is above the Kumo.
- A weak bearish signal occurs when the cross is above the Kumo.
- A neutral bearish signal occurs when the cross is inside the Kumo.
- A strong bearish signal occurs when the cross is below the Kumo.


![[Two Different Approaches to Market Timing]: The Spiral Calendar and the VISTmany Research Project](https://c.mql5.com/6/1012/splash-preview-771691.png "[Two Different Approaches to Market Timing]: The Spiral Calendar and the VISTmany Research Project")

