 Volatility Index")
The One Thing You Should Know About Stock And Volatility - VIX is an acronym for the Chicago Board Options Exchange (CBOE) Volatility Index

The VIX
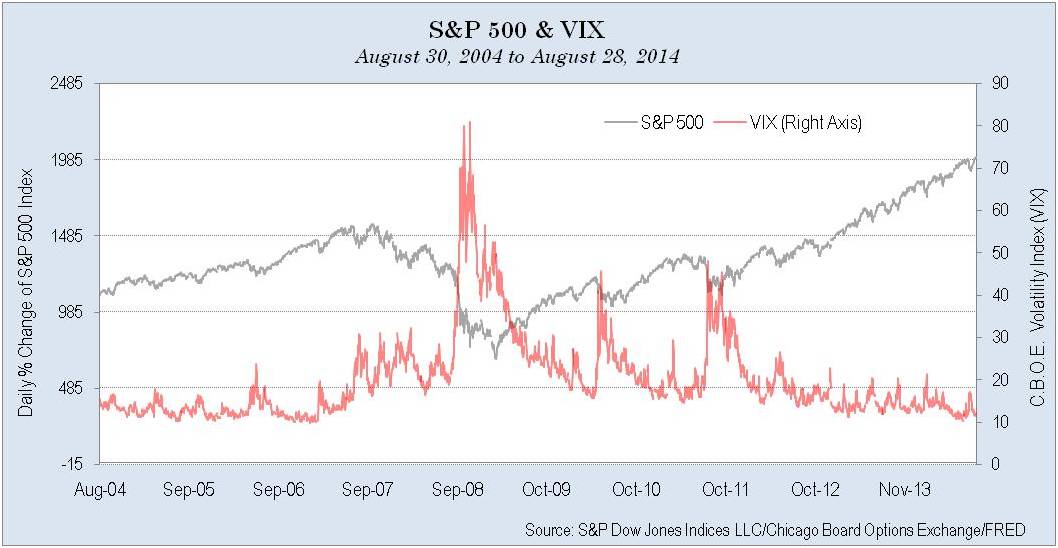
The VIX is an acronym for the Chicago Board Options Exchange (CBOE) Volatility Index. It is one measure of the market’s expected volatility over the next 30 days and fluctuates throughout the trading day. The VIX was formally introduced in 1993. In general, as the VIX rises (which indicates greater fear of market volatility) stocks tend to decline and vise versa. The following chart illustrates the relationship between the VIX and the S&P 500 Index from August 30, 2004 to August 28, 2014.
Correlation Explained
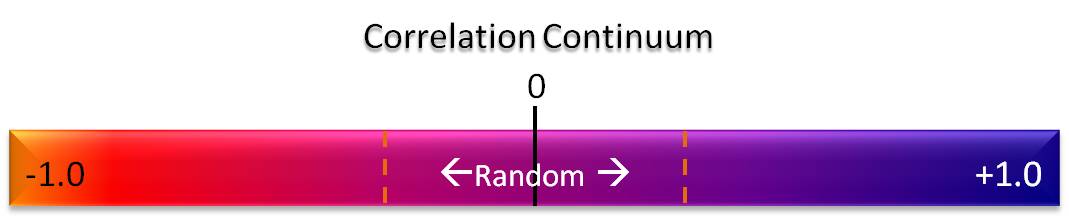
With a cursory glance at the chart above you may notice how the two move in the opposite direction a great deal of the time. This is quantified using correlation, a statistical measure of how two sets of data move in relation to each other. For example, the entire correlation continuum ranges from a negative 1.0 to a positive 1.0 (See: Correlation Continuum exhibit below). To clarify, if two sets of data have a correlation of positive 1.0, this would indicate that they move together or in sync. Conversely, a correlation of negative 1.0 indicates the opposite. Moreover, a correlation between positive 0.3 and a negative 0.3 indicates a random relationship which implies that the two sets of data move randomly and are not influenced by each other.
Stocks And The VIX
Here’s where it gets interesting. The correlation between the S&P
500 and the VIX, using the time period in the chart, is negative 0.58
which indicates a fairly strong negative relationship. In other words,
as a general rule, when one rises or falls, the other does the opposite.
Many analysts have been waiting for the “other shoe to drop” for
quite some time. Moreover, when it does, stock prices are likely to
fall. In fact, the longer this rally persists the greater the risk of a
more serious decline. Actually a stock correction is not a question of if but when.
We know that stocks usually run too far to the upside as well as the
downside. Since the market bottomed in February 2009, with the
exception of two corrections in 2010 and 2011, volatility (i.e. risk)
has been relatively low and stocks have been trending higher.
Conclusion
How long will the rally last? That’s a question without an answer.
However, in the interim I wouldn’t recommend piling into stocks because
when the music finally stops – and stop it surely will – stock
investors are likely to experience a great deal of pain. The bright
spot is that when the correction comes, it will present a great
opportunity to load up on this risky asset class. Until then, try to be
patient because good things come to those who wait!


