
Price Pattern Analysis: S&P 500, GOLD and CRUDE OIL - Gold Trying to Expose 1200 Anew, Crude Oil May Move Upward
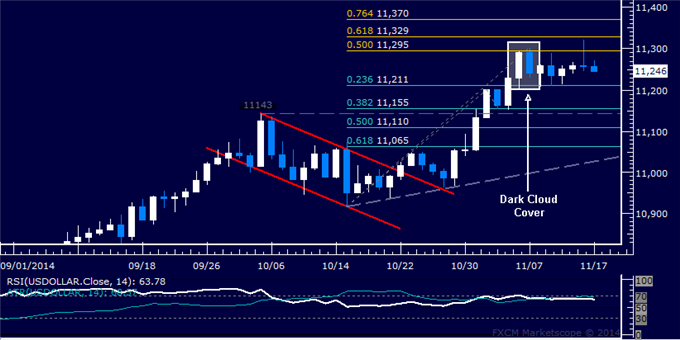
Prices may be gearing up for a turn lower after producing a bearish Dark Cloud Cover candlestick pattern. Near-term support is at 11211, the 23.6% Fibonacci retracement, with a break below that on a daily closing basis exposing the 11143-55 area (October 3 high, 38.2% level).
S&P 500 TECHNICAL ANALYSIS
Prices are treading water after
setting yet another record high last week. Near-term resistance is at
2051.00, the 23.6% Fibonacci expansion, with a break above that on a
daily closing basis exposing the 38.2% level at 2081.20.

GOLD TECHNICAL ANALYSIS
Prices are attempting to launch a
recovery, with a break above support-turned-resistance marked by the
October 3 low at 1189.89 exposing the 38.2% Fibonacci retracement at
1212.23. Alternatively, a reversal below the 1178.86-80.84 area
(December 2013 low, 23.6% level) targets the 14.6% retracement at
1161.49.

CRUDE OIL TECHNICAL ANALYSIS
Prices may be gearing up for a
recovery after putting in a bullish Piercing Line candlestick pattern. A
break above the 14.6% Fibonacci retracement at 79.81 exposes the
intersection of a falling trend line and the 23.6% level at 81.71.


")

")