
A look at how to trade the AB=CD Pattern.
This is educational video about how to trade this pattern.
There are a few key steps:
- Identify the start of the trend (point A to point B)
- Once the market begins to retrace at Point B, use Fibonacci lines to measure a retracement
- Point C is the Fibonacci line where the retracement ends
- Point D is the next top in the trend. The distance from Point A to Point B is equal to Point C to Point D.
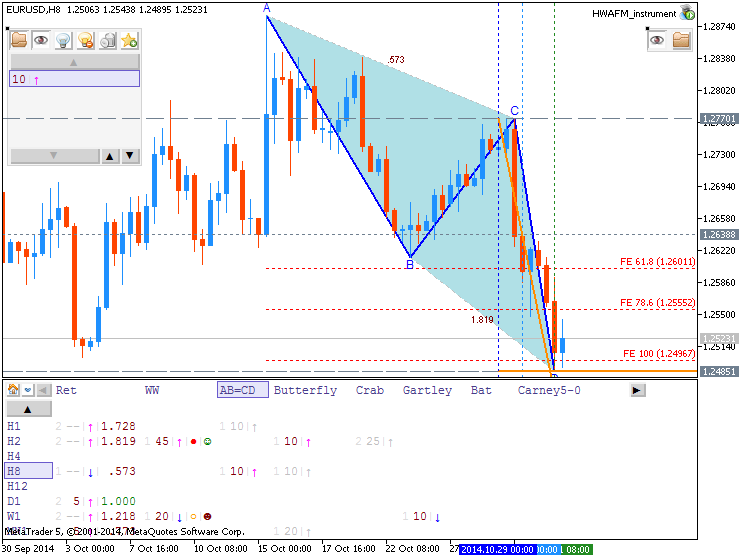
This is the forming AB=CD pattern for bullish, EURUSD, H8 timeframe:
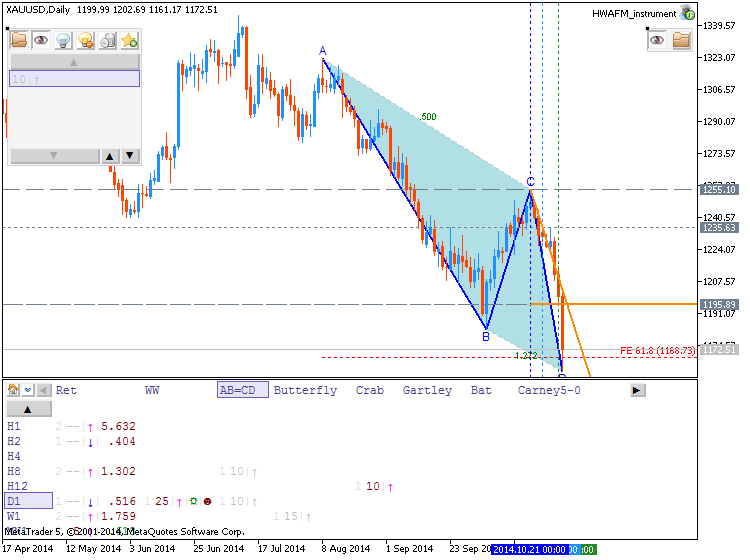
This is forming bullish AB=CD pattern for GOLD (XAUUSD):