
EURUSD Intra-Day Technical Analysis - Flat with Triangle Broken for Possible Uptrend Continuing
29 October 2014, 14:44

0
473
H1 price is on primary bullish with secondary falt since yesterday evening floating between 1.2746 resistance and 1.2723 support levels.
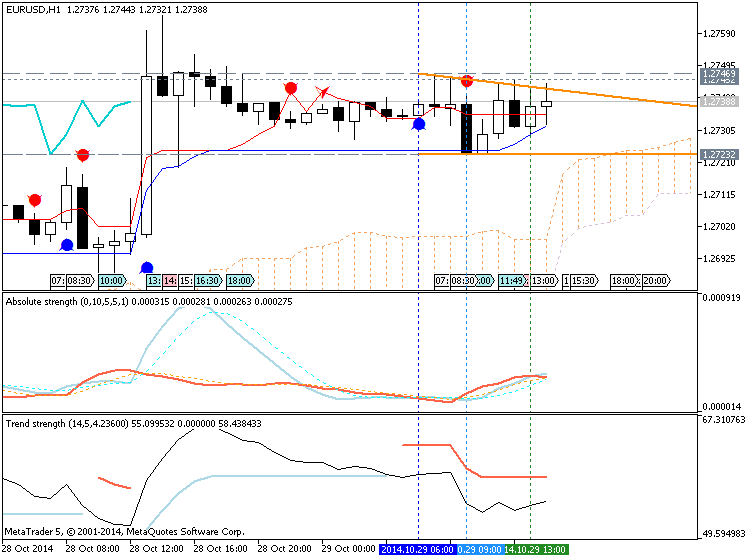
| Resistance | Support |
|---|---|
| 1.2745 | 1.2723 |
| 1.2746 | 1.2705 |
H4 price is on secondary flat with the following details:
- it located inside Ichimoku cloud/kumo above Senkou Span A line which is the border of the cloud. This is indicating the ranging market condition (because the price is inside kumo) with primary bullish (because the price is above Senkou Span A line which is vistual border between primary bearish and primary bullish on the chart).
- triangle price pattern is broken for uptrend with nearest resistance as 1.2752 and next one is 1.2764
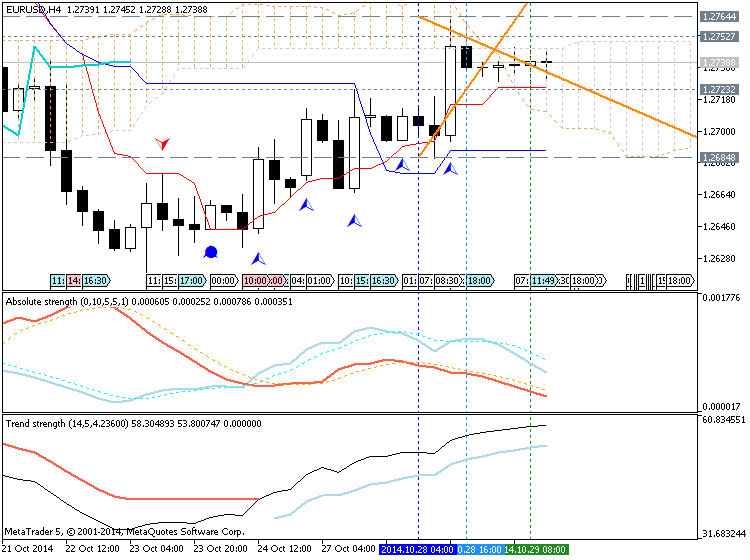
| Resistance | Support |
|---|---|
| 1.2752 | 1.2723 |
| 1.2764 | 1.2684 |
If H4 price will cross 1.2764 resistance on close H4 bar so the bullish trend will be started with good possibility to open buy trade for example.
If not so we may see the ranging market condition within bullish (good for counyer-trend systems, martingale and scalping).
- Recommendation for long: watch H4 price to break 1.2764 resistance for possible buy trade
- Recommendation
to go short: N/A
- Trading Summary: ranging
SUMMARY : Bullish
TREND : ranging


 & AMD Framework")
")