
USDCAD Technical Analysis - Monthly Forecast for 2015: Ranging Bullish

MN price:
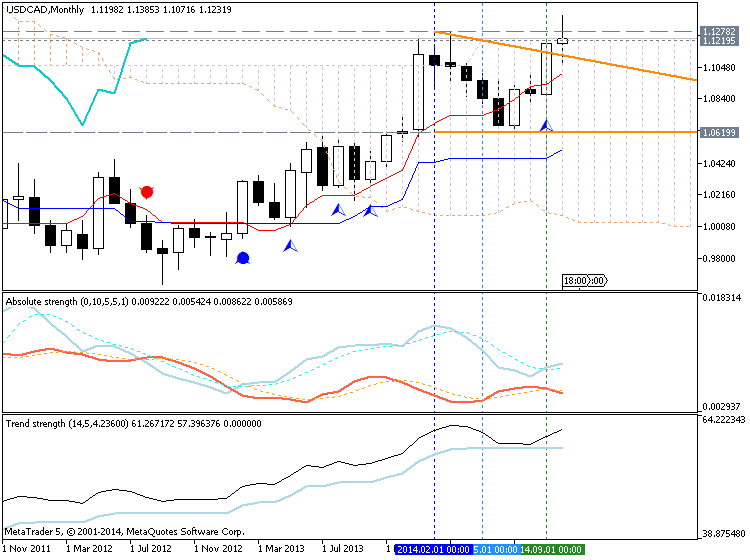
The price is located Above Senkou Span A line which is the border of Ichimoku cloud/kumo and virtual border between primary bearish and primary bullish on the chart. So, this is primary bullish for this timeframe. But the price is located inside Ichimoku cloud for ranging and exact near Senkou Span B line of Ichimoku indicator and ready to break it for good breakout.
- If the price will break Senkou Span B line so we may see good breakout of the price movement and the bullish market condition up the end of 2015.
- If not so it will be bullish ranging (secondary ranging within primary bullish).
The nearest resistance lines are 1.1219 and 1.1278, and if the price will cross 1.1278 so the bullish trend will be continuing on monthly timeframe.
- if
MN1 price will cross 1.1278 resistance level on close
monthly so the bullish trend will be continuing for the next 2015.
- if not so the price will be in ranging market condition within Ichimoku cloud/kumo floating between the borders of komu - Senkou Span A and Senkou Span B lines.
| Resistance | Support |
|---|---|
| 1.1219 | 1.0619 |
| 1.1278 | 1.0032 |
To make it shorter - I am expecting the secondary ranging market condition with the primary bullish for the next year which may be good for martingale systems, for counter trend strategies and for scalping for example.
Trading Summary: ranging bullish
If we look at patterns for MN1 timeframe so we can see bearish Retracement forming pattern:
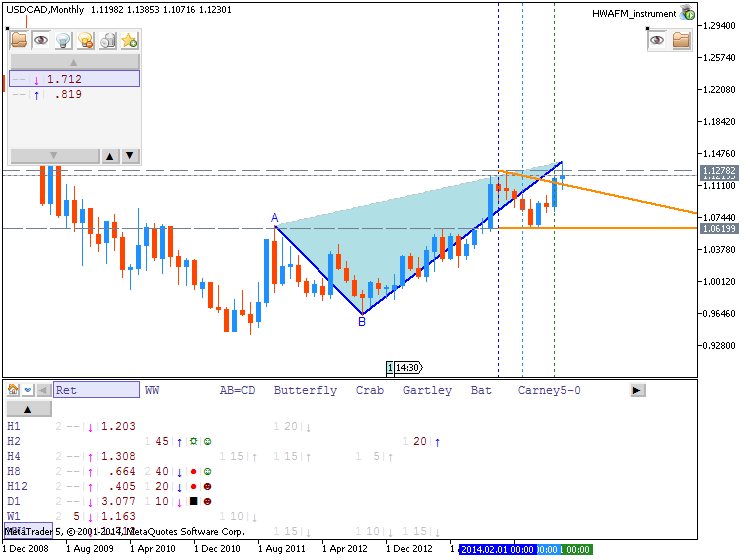
Thus, I think - most effective way to know about where the price will
go to the next year is watching the levels for MN1 timeframe. My
expectation is ranging bullish.


")
![[XAUUSD]: Weekly Liquidity Activation Points (timings), June 22-26, 2026](https://c.mql5.com/6/1013/splash-preview-771790.png "[XAUUSD]: Weekly Liquidity Activation Points (timings), June 22-26, 2026")
")