
A New Approach to Custom Criteria in Optimizations (Part 1): Examples of Activation Functions
Introduction
The quest for the ideal optimization to find the right combination of parameters continues. The forum is awash with suggested methods to persuade the MetaTrader Optimizer to return and rank the various passes to enable a developer to choose a combination (or combinations) of parameters that are stable. The introduction of prop firms into the mix with their rigorous boundaries, understandably much more rigorous than might be required by a private trader, has made this even more testing.
The ability to define a Custom Criterion, and even utilize the Complex Criterion with its opaque methodology, has introduced the ability to reduce the parsing or at the least analysis of results in Excel, Python, R, or in proprietary software, to obtain the best permutation of parameters.
The problem is, that it is still not uncommon to see the use of return(0) in published Custom Criteria. This is fraught with actual, or potential, dangers, including the potential to discard (barely) unwanted results, or worse, to divert the genetic optimization process from potentially productive paths.
In an attempt to go back to some first principles, having conducted some very empirical experiments, I attempted to find some curve equations. To do this, I looked at “Activation Functions in Neural Networks” and adopted and modified some for use here. In addition, having elucidated these, I have suggested some methods to put them to practical use.
The plan for this article series is as follows:
- Introduction and standard Activation Functions with MQL5 code
- Modifications, scaling and weighting and real examples
- A tool to explore different curves, scaling and weighting
- Any other points that arise...
Current state of the use of Custom Criteria
Two contributors, for whom I have the greatest respect, made some excellent points to illustrate the problem, with concerns regarding the use of return(0) and the results returned by Complex Criterion. Alain Verleyen, a moderator of the forum, reports a pass returning a loss of 6,000 scoring higher than one returning a profit of 1,736 with more trades (and scoring considerably better for Profit Factor, RF, Sharpe ratio AND drawdown). Alain says, ‘the cryptic "complex criterion" gives some strange results.’ I would go further to say it must surely cast significant doubt on the methodology behind Complex Criterion. If indeed, as Muhammad Fahad comments later in the same thread - and I am sure he is right - ‘negative balance results aren't particularly bad for optimization, they play a crucial role in the future generation's judgment of bad from worst while genes are being crossed’, the return of such a positive score could possibly misdirect the genetic optimizer.
It has been a long, long time since I used MT4, but I dimly recall the ability to enter constraints for certain outcome statistics. In MQL5 there appears at first glance not to be able to do this other than to use the very blunt instrument of return(0) in a Custom Criterion, the potential downsides of which have already been mentioned. It occurs to me that if we can get a return value very close to 1 when the ratio or metric is at or above our desired minimum, at or below our desired maximum, or even at or close to a specific target, and then by multiplying the values for each metric/ratio together and then multiplying the result by 100, we might be onto something...
Why look at Neural Networks for inspiration?
i) Genetic optimization as Neural Network... Whether or not the genetic algorithm has a neural network behind it, the logical process appears to be the same - try a parametric combination, score it (according to the optimization criterion selected), retain potentially profitable selections for further enhancement and discard the rest. This is repeated until improvement in the selected score plateaus.
ii) Valleys, exploding gradients, weighting, normalization and manual selectionThe problem of the non-convex error surface is well known in Machine Learning. Similarly, it appears that we could, in genetic optimization, end up down local minima or saddle points, misdirected by return(0) statements causing the discarding of ‘knowledge’ by the genetic algorithm.
The processing of various metrics to form a custom criterion also needs a great deal of thought... my early attempts were very crude, using various factors for division and multiplication, not to mention exponential factors, leading to scores verging on the insanely high (exploding gradient)... The complex criterion score algorithm clearly uses a function to limit the score between 0 and 100, hinting at its use of a Sigmoid or logistic type function.
The need to apply weights to the individual components of a custom criterion is clear: we need to use weights to determine the priority of the various components, and normalization both of the inputs, to tune the sensitivity of our model, and of the output to enable comparison between models. We will look at weighting and normalization in a future article.
When we look at the output of an optimization run, either manually or in a spreadsheet, we might sort by various output measures, filter out results, and quickly, almost subconsciously, select parameter sets by color of the key metrics. Here we are simply reapplying the processes described, which are themselves an attempt to mimic our own intellectual processing of the full outcome.
Activation Functions in Neural Networks
It strikes me that the functions I was looking for were akin to those I came across a year or two ago when looking at Activation Functions in Neural Networks.
Activation Functions in Neural Networks can be broadly classified into three types: binary, linear, and non-linear:
- Binary functions classify values into 1 of 2 classes by returning 1 or 0. These are not particularly useful in our use case;
- Linear functions return transformations by simple addition, multiplication, subtraction or division or a combination thereof. They are also of little help in our use case.
- Non-linear functions return results curves which are constrained at the extremes of x but allow discrimination of values of x through a range centered on 0. This range and center can be modified through the use of offsets.
It should be said that the use of
return(0);
as well as the unrestricted return of the product of numerous outcome measures, both of which I have been guilty of, and both of which I still see on the fora, are methods which replicate the problems associated with these first two classes; on the other hand, non-linear functions tend to be constrained to prevent exploding gradients, while maintaining a gradient from -∞ to ∞.
By way of explanation, I will recap some of the standard examples. We will look at ReLU, Softplus, Sigmoid and Tanh, along with, in the next article, my own modifications, Flipped ReLU, Point ReLU, Flipped Sigmoid, Point Sigmoid, Flipped Tanh and Point Tanh.
a) ReLU Activation Function
The point of this function is to return zero when x is <= 0 and x if x > 0, or, in mathematical notation, f(x) = max(0,x). The line obtained is illustrated below, and the MQL5 function can be defined thus:
double ReLU(double x) {
   return(MathMax(0, x));
}
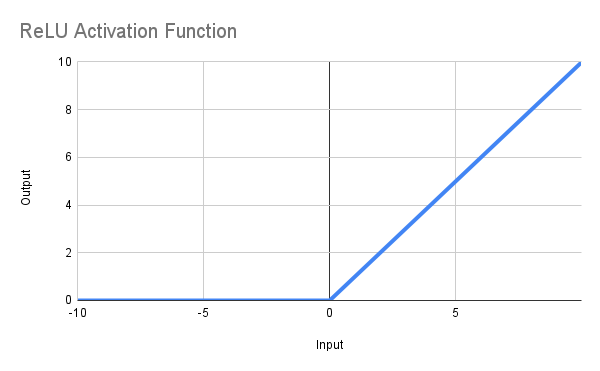
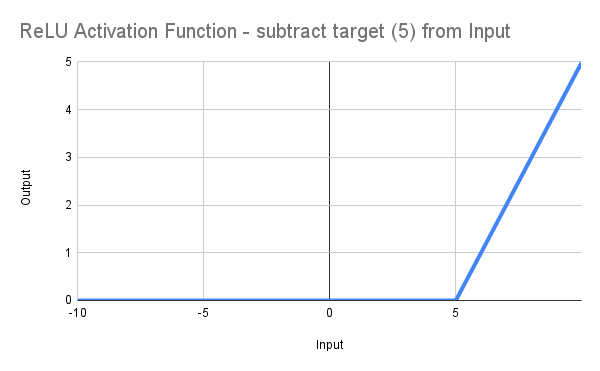
So far, so good you may say, but I want to target a minimum value for Recovery Factor of 5 or above..., well, simply change the code to * :
input double MinRF = 5.0;

double RF = TesterStatistics(STAT_RECOVERY_FACTOR);
double DeviationRF = RF - MinRF;

double ReLU(double x) {
   return(MathMax(0, x));
}

double ScoreRF = ReLU(DeviationRF);
thus shifting the line to the right, taking off from 0 at RF = 5.0 as illustrated:
This, of course, is hardly any more advanced than writing*
input double MinRF = 5.0;

double RF = TesterStatistics(STAT_RECOVERY_FACTOR);
double ScoreRF = (RF - MinRF);
but it gives us a start...
* there is another issue in that the target value, 5, will actually return 0 and only values >5 will return non-zero. I do not intend to spend time on this issue, as the various other problems with this function preclude it from further utility in our use case.
Problems
It soon becomes clear that we still have 2 problems, which are both a function of the inherent simplicity of our code... I said, above:
"This, of course, is hardly any more advanced than writing
input double MinRF = 5.0;
double RF = TesterStatistics(STAT_RECOVERY_FACTOR);


double ScoreRF = (RF - MinRF);
but it gives us a start..."
The problems are well recognized in Neural Networks:
-
Dying ReLU: ReLU's major weakness is that neurons can permanently "die" when they output only zeros. This occurs when strongly negative inputs create zero gradients, rendering these neurons inactive and unable to continue learning. This is also referred to as the vanishing gradient problem.
-
Unconstrained Output: ReLU outputs can grow infinitely large for positive inputs, unlike Sigmoid or Tanh functions, which have built-in upper limits. This lack of an upper constraint can sometimes cause gradient explosion issues during the training of deep neural networks. This is also referred to as the exploding gradient problem.
The second issue is dealt with in statistics by normalizing values across an observation window, but this method is unavailable to us within the confines of the optimizer.
We therefore need a solution which will
- mathematically generate constraint, providing an automated normalization; and
- provide some degree of linearity, rather than returning 0, across a significant section of the sample...
b) Softplus Activation Function
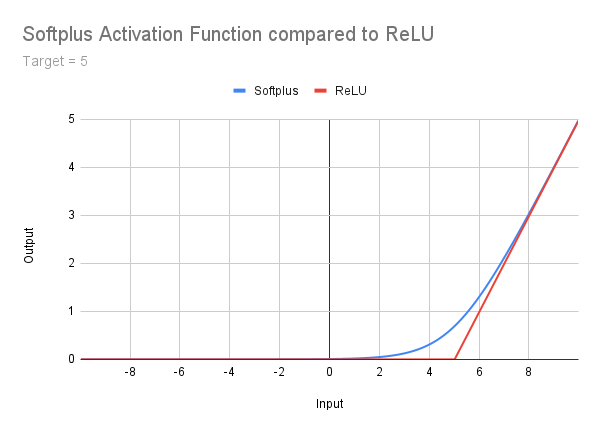
I do not intend to go into this in great detail here, but I mention it in passing as a stage between ReLU and the higher functions. It is well described at Geeksforgeeks and I will simply post the following picture, formula and code. It should be apparent that while dealing with the Dying ReLU Problem, the Unconstrained Output problem continues. In addition, there is the smooth transition between the very shallow tail and the right-hand slope. This introduces the need to consider a correction offset - a concept we will return to later:
double Softplus(double x) {
   return(MathLog(1 + MathExp(x)));
}
Enjoy reading up if you wish, but now we come to functions that give us constrained results between 0 and 1...
c) Sigmoid Activation Function
The Sigmoid Function is expressed mathematically as f(x) = 𝛔(x) = 1 / (1 + e^(-x)). It is identical to the derivative of the Softplus function and can be coded in MQL5 thus:
double Sigmoid(double x) {
   return(1 / (1 + MathExp(-x)));
}
Looking at the curve (below) it is immediately apparent that
-
it is constrained between 0 and 1, thus solving our Unconstrained Output problem;
-
although difficult to appreciate at this scale, a varying gradient, which never becomes zero, is maintained from -∞ to ∞; and
-
the unshifted curve scores 0.5 at a value of 0.
To deal with 3), so as to approach 1 when x == our threshold (target) value, it is necessary to shift the curve to the left, not only by our threshold value, but also by a correction which is achieved practically by using a correction value >= 5.
The implementation in MQL5 is therefore
input double MinRF = 5.0;
sinput double SigCorrection = 5;

double RF = TesterStatistics(STAT_RECOVERY_FACTOR);
double DeviationRF = RF - MinRF;

double CorrectedSigmoid(double x) {
   return(1 / (1 + MathExp(-(x - SigCorrection))));
}

double ScoreRF = CorrectedSigmoid(DeviationRF);
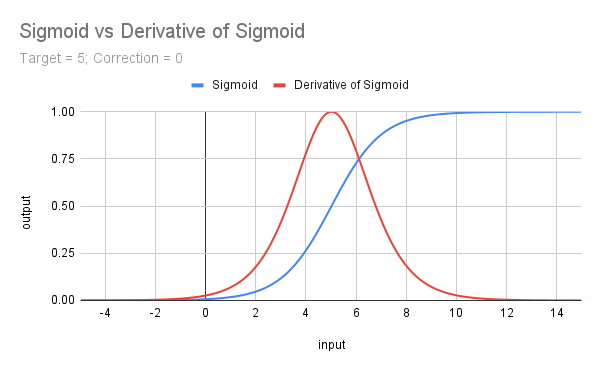
The curve of the uncorrected Sigmoid Function is illustrated below for a target of 5, along with the derivative (multiplied by 4) which will be discussed next.
d) Derivative of Sigmoid (𝛔')
This gives us a nice shape, centered and maximized at x = 0... It represents the slope of the Sigmoid Function, and the formula is f(x) = 𝛔(x) - 𝛔^2(x) or 𝛔(x) * (1 - 𝛔(x)).
The function suffers potentially (as do all non functions we will consider) from the vanishing gradient problem, a risk which may be ameliorated by the simple expedient of multiplying it by 4 (since 𝛔’(x) = 0.25), which also then, usefully, constrains the result once more between 0 and 1. The centering on a value of x enables us to target a point or, more correctly, a range centered on a point.
In MQL5 we can do
input double TargetTrades = 100;

double Trades = TesterStatistics(STAT_TRADES);
double DeviationTrades = Trades - TargetTrades;

double Sigmoid(double x) {
   return(1 / (1 + MathExp(-x)));
}

double Deriv4Sigmoid(double x) {
   return(4 * (Sigmoid(x) * (1 - Sigmoid(x))));
}

double ScoreTrades = Deriv4Sigmoid(DeviationTrades);
Note: since our results for Sigmoid, its Derivative (multiplied by 4), and the following Tanh and its Derivative, both rescaled to between 0 & 1, are all constrained between 0 and 1, we do not need to provide any further scalar in production. We can, of course, multiply by any factor to normalize them to, or prioritize them over, any other Optimization Ratios we might be including in our final Custom Criterion. Let us look at this in the next article.
We have one final standard function to explore, and that is Tanh...
e) Hyperbolic tangent or Tanh
Tanh is the last of our Activation Functions, that we are going to explore in our quest for utility in Custom Criteria. I will follow a similar pattern with less explanation than before, but applying the same principles.
The following graph displays the plot of Tanh with its Derivative.
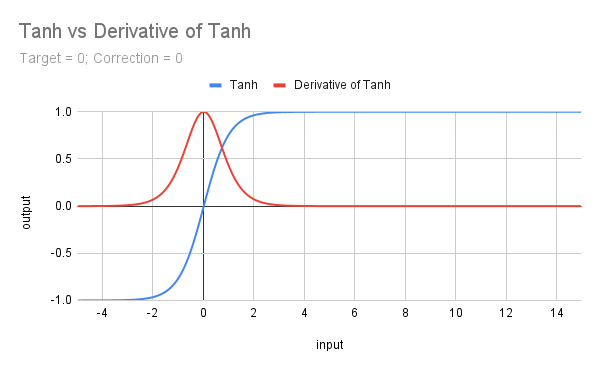
The formula for Tanh is f(x) = (e^x - e^(-x))/(e^x + e^(-x)) and in MQL5 it has its own function so is straightforward to code. Of course, we have to handle target values and correction factors, but it still makes life easy:
input double MinRF = 5.0;
sinput double TanhCorrection = 2.5; // Anything between 2 and 3 would be reasonable (see last figure)

double RF = TesterStatistics(STAT_RECOVERY_FACTOR);
double DeviationRF = RF - MinRF;

double CorrectedRSTanh(double x) {
   return((MathTanh(x  + TanhCorrection) + 1) / 2);  // rescaled and corrected
}

double ScoreRF = CorrectedRSTanh(DeviationRF);
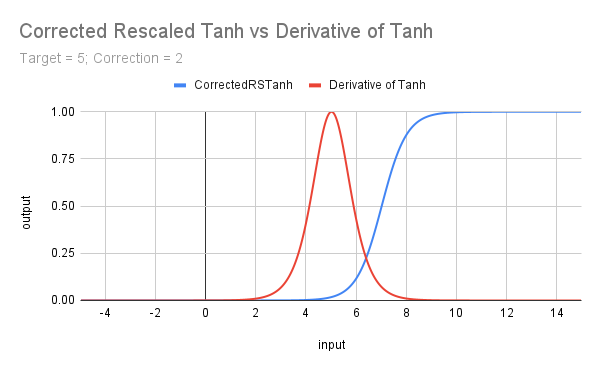
The code above rescales the underlying function to constrain it between 0 and 1 (by adding 1 and dividing by 2). It also introduces a correction factor and a target, and the resulting curve is shown in the next graph illustrating the Derivative of Tanh. It should not escape anyone's notice that Tanh has a similar shape to Sigmoid, and the Derivatives to each other; we shall explore these similarities in the next article.
f) Derivative of Tanh
The mathematical formula for the Derivative of Tanh is f(x) = 1 - Tanh^2(x).
In MQL5 we can do
input double TargetTrades = 100;

double Trades = TesterStatistics(STAT_TRADES);
double DeviationTrades = Trades - TargetTrades;

double DerivTanh(double x) {
   return(1 - MathPow(x, 2));

}double ScoreTrades = DerivTanh(DeviationTrades);
This next graph shows the effect of rescaling the Tanh, correcting it to approximate the takeoff from 0 with the target (threshold) value of x, and introducing a target to both Tanh and Derivative of Tanh.
Summary and Next Steps
In this article, we briefly considered the relationship between Machine Learning on the one hand, and the optimization process with ‘post-processing’ (whether genetic or full), plus excel or manual post-processing, on the other. We have started to look at the way various types of Activation Functions might refine Custom Criteria and how to code them.
The problems of the vanishing and exploding gradients in ReLU and Softplus have led us to turn our attention to functions with curves like that of the Sigmoid function and also that of its Derivative. We have seen how these allow us to favor, in our scoring, single bound ranges (i.e x > t) or doubly bound ranges (t1 < x < t2) while eliminating the problem of exploding gradients and mitigating that of vanishing gradients.
We have looked at the use of correctional offsets and target offsets to help ensure focussing on desired attribute value ranges.
In the next article, we shall look at some modifications to this list of standard functions with similar but not identical attributes. We will also explore the idea of scaling and weighting before looking at examples of the use of different functions in Custom Criteria.
Warning: All rights to these materials are reserved by MetaQuotes Ltd. Copying or reprinting of these materials in whole or in part is prohibited.
This article was written by a user of the site and reflects their personal views. MetaQuotes Ltd is not responsible for the accuracy of the information presented, nor for any consequences resulting from the use of the solutions, strategies or recommendations described.
 USD and EUR index charts — example of a MetaTrader 5 service
 Tabu Search (TS)
 From Novice to Expert: Support and Resistance Strength Indicator (SRSI)
 MQL5 Wizard Techniques you should know (Part 57): Supervised Learning with Moving Average and Stochastic Oscillator
- Free trading apps
- Over 8,000 signals for copying
- Economic news for exploring financial markets
You agree to website policy and terms of use