Expert System 'Commentator'. Practical Use of Embedded Indicators in an MQL4 Program
An experienced trader will never open a position if no technical indicator confirms
this decision. For example, the trader has conducted technical analyses and concluded
that it is possible to open a long position for a security, let it be EURUSD. To
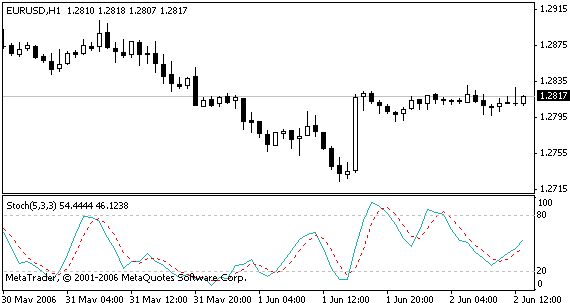
enter the market at the current price (see Fig. 1 below), an experienced trader
checks the results obtained by an indicator, for example, Stochastic Oscillator,
and waits until it gives a confirming signal. The indicator and its signals are
described here: https://www.metatrader5.com/en/terminal/help/indicators/oscillators/so. In our exemplary case, let us take a signal that is described there.
"...Buy when the %K line rises above the %D line and sell when the %K line
falls below the %D line."

%K is the main line, %D (dashed) is the signal line. MQL4 allows use of embedded functions for calculations of indicators. The full list of those functions is given at the end of this article and in the MQL4 documantation. Indicator Stochastic Oscillator is among them, too. To calculate values of the main and of the signal line, the function below is used:
double iStochastic( string symbol, int timeframe, int %Kperiod,
                    int %Dperiod, int slowing, int method,
                    int price_field, int mode, int shift)
The function is described in more details in the MQL4 documentation.
Below is the value calculation for the main line of indicator Stochastic Oscillator in MQL4:
iStochastic(NULL,0,5,3,3,MODE_SMA,0,MODE_MAIN, i)
Parameters 3,5,5 here are period values of the indicator averages, MODE_SMA is the method to calculate moving
average, i – the number of the candlestick, for which the value is calculated, parameter MODE_MAIN informs
that the main line (%K) must be calculated. Respectively, below is the calculation of the signal line:
iStochastic(NULL,0,5,3,3,MODE_SMA,0,MODE_SIGNAL, i)
When using the embedded functions of indicator calculation, it is necessary to specify the chart timeframe and symbol. In our case, the current symbol and the current timeframe of the chart (parameters NULL and 0) are considered. It is necessary to remember that calculations can be made on any symbols and for any timeframes. It can be seen in the Stochastic Oscillator chart that the main line value is equal to 54.4444 and the signal line value is 46.1238, i.e.:
iStochastic(NULL,0,5,3,3,MODE_SMA,0,MODE_MAIN, i) >
iStochastic(NULL,0,5,3,3,MODE_SMA,0,MODE_SIGNAL, i)
It will be easy for us now to automate indicator calculations. It would be convenient
if the indicator did not consume space in the price chart. The best soultion would
be to eliminate the indicator graph from the chart and only show the signal calculated
above. The most popular method to show signals is placing Wingdings characters
in the chart. We will discuss this method later and now let us try to use another
feature of MQL4. It is operator named Comment().
void Comment( ...)
It helps to show any comments in the chart price.
//STOCH

      double valSTOCH=0;
      string commentSTOCH = "Stoch:         ";
      string commentSTOCHAdd = "   No data ";
      if(iStochastic(NULL,0,5,3,3,MODE_SMA,0,MODE_MAIN,0)
>iStochastic(NULL,0,5,3,3,MODE_SMA,0,MODE_SIGNAL,0))
        commentSTOCHAdd =  "    Buy is possible";

      if(iStochastic(NULL,0,5,3,3,MODE_SMA,0,MODE_MAIN,0)
<iStochastic(NULL,0,5,3,3,MODE_SMA,0,MODE_SIGNAL,0))
        commentSTOCHAdd =  "    Sell is possible";

      commentSTOCH =  commentSTOCH + commentSTOCHAdd;
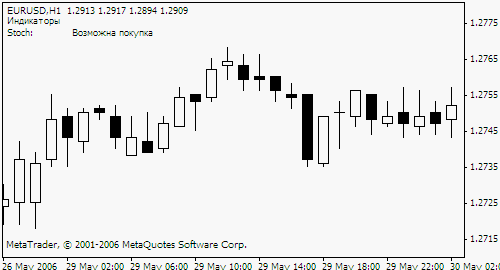
The source code above translates the signal into a text in order to show it in the
chart.
Comment(commentSTOCH + "\n");
The Comment is convenient since the user can utilize the line-feed character to
visualize comments line by line. Using the code above, a trader can eliminate the
graph of Stochastic Oscillator. It will have an alarm system that will show the
current market developments as texts.

Now let's consider, for instance, Commodity Channel Index (CCI).
"...measures the deviation of the commodity price from its average statistical price. High values of the index point out that the price is unusually high being compared with the average one, and low values show that the price is too low. In spite of its name, the Commodity Channel Index can be applied for any financial instrument, and not only for the wares."
Having automated CCI signal calculations, we will get an additional comment like "The price is presumably too high". Using, for example, technical indicator named Acceleration/Deceleration (AC) that measures acceleration/deceleration of the current trend, the trader can be informed even better. "...If you realize that Acceleration/Deceleration is a signal of an earlier warning, it gives you evident advantages."
This is how the code displaying signals from several indicators may look:
//   Demarker
      double valDem=iDeMarker(NULL, 0, 13, 0);
      string commentDem = "DeMarker:    ";
      string commentDemAdd = "   No data";

      if (valDem < 0.30)
         commentDemAdd =  "   Prices are expected to go Up";

      if (valDem > 0.70)
         commentDemAdd =   "   Prices are expected to go Down";
      commentDem = commentDem + commentDemAdd;

//ATR
      double valATR=iATR(NULL, 0, 12, 0);
      string commentATR = "ATR:           ";
      commentATR=commentATR + "   Trend will probably change " + valATR;

//CCI
      double valCCI=iCCI(NULL,0,12,PRICE_MEDIAN,0);
      string commentCCI = "CCI:            ";
      string commentCCIAdd = "   No data ";
      if (valCCI > 100)
        commentCCIAdd =  "   Overbought " +
                         "(a correcting down-trend is possible) ";

      if (valCCI < -100)
        commentCCIAdd =  "   Oversold " +
                         "(a correcting up-trend is possible) ";

      commentCCI =  commentCCI + commentCCIAdd + valCCI;

//MFI
      double valMFI=iMFI(NULL,0,14,0);
      string commentMFI = "MFI:            ";
      string commentMFIAdd = "   No data ";
      if (valMFI > 80)
        commentMFIAdd =  "    a possible market peak ";

      if (valMFI < 20)
        commentMFIAdd =  "    a possible market trough ";

        commentMFI =  commentMFI + commentMFIAdd + valMFI;
Calculations can also be made with arrays. Functions that end with OnArray can be
used for this purpose, for example, function iMAOnArray that calculates moving
average on the data array. It is interesting that some indicators sometimes tend
to give opposite signals. Well, for a trader, no signal is a signal, too. Trading
is not only making a decision about the direction to open a position, but also
the open time. Expert system "Commentator" calculates signals for only
the current timeframe, though a trader can add calculations for larger or smaller
timeframes to the program code. It should also be noted that the use of MQL4 does not tighten the trader in any
way, but elevates the mind and enhances functionality.
The functions of embedded indicator calculations available in the MQL4 are given below:
iAC
iAD
iAlligator
iADX
iATR
iAO
iBearsPower
iBands
iBandsOnArray
iBullsPower
iCCI
iCCIOnArray
iCustom
iDeMarker
iEnvelopes
iEnvelopesOnArray
iForce
iFractals
iGator
iIchimoku
iBWMFI
iMomentum
iMomentumOnArray
iMFI
iMA
iMAOnArray
iOsMA
iMACD
iOBV
iSAR
iRSI
iRSIOnArray
iRVI
iStdDev
iStdDevOnArray
iStochastic
iWPR
Translated from Russian by MetaQuotes Ltd.
Original article: https://www.mql5.com/ru/articles/1406
Warning: All rights to these materials are reserved by MetaQuotes Ltd. Copying or reprinting of these materials in whole or in part is prohibited.
This article was written by a user of the site and reflects their personal views. MetaQuotes Ltd is not responsible for the accuracy of the information presented, nor for any consequences resulting from the use of the solutions, strategies or recommendations described.
 Pivot Points Helping to Define Market Trends
 Events in МetaТrader 4
 Genetic Algorithms vs. Simple Search in the MetaTrader 4 Optimizer
 Synchronization of Expert Advisors, Scripts and Indicators
- Free trading apps
- Over 8,000 signals for copying
- Economic news for exploring financial markets
You agree to website policy and terms of use
Comment() is using proportional port so if you tries to formatoutput like:
You get this: