DSZ Smart Volume
- Indikatoren
- Version: 2.0
- Aktualisiert: 28 Januar 2022
- Aktivierungen: 5

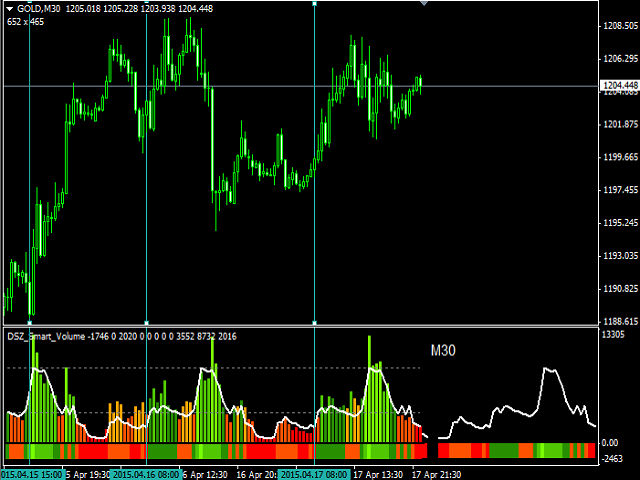
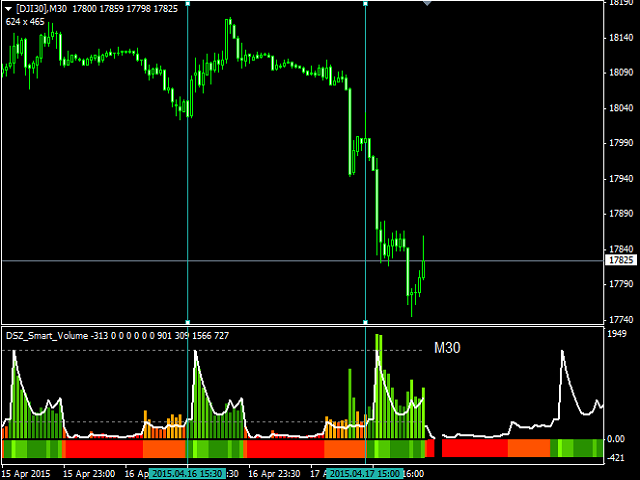
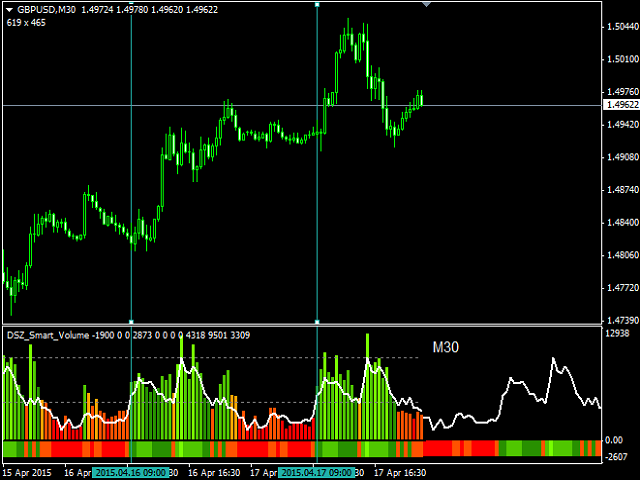
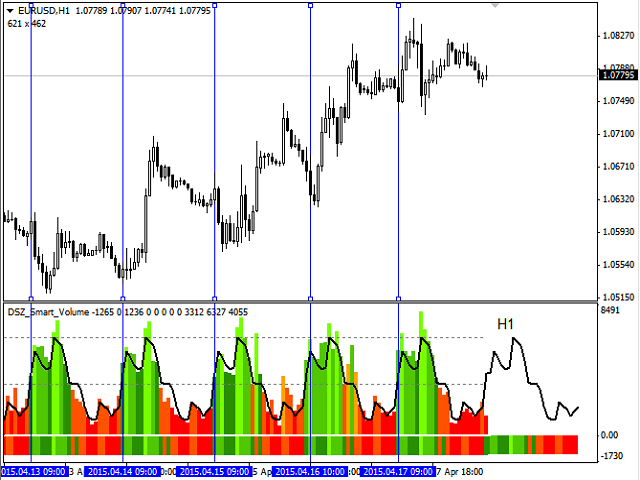
DerDSZ Smart Volume Indikator zeigt die aktuellen und zukünftigen Werte des Volumens an. Jedes Instrument hat seine eigene Persönlichkeit, die sich aus Ereignissen wie Markteröffnungen, Mittagszeiten, Nachrichtenmeldungen und der Nacht ergibt. DSZ Smart Volume analysiert einfach das Volumen statistisch, um die Volumenverteilung über den Tag zu erstellen. Die Volumenbalken sind rot, wenn die Werte unter dem Durchschnitt liegen, und grün, wenn sie darüber liegen.
Die Linie stellt die Verteilung des Volumens über einen Tag dar. Das farbige Band im unteren Bereich stellt die Volumenverteilung dar.
Auswertung
Rot
- Volumen unter dem Durchschnitt.
- Größere Spanne.
- Niedrige Preisspanne.
- Geringe Wahrscheinlichkeit für profitablen Handel.
Grün
- Volumen über dem Durchschnitt.
- Dünnere Spreads.
- Größere Preisspanne.
- Größere Wahrscheinlichkeit für einen profitablen Handel.
Übergang Rot -> Grün und steigende Volumenverteilung
- Neues Geld auf dem Markt.
- Beginn von neuen großen Preisbewegungen.
Übergang Grün -> Rot und scheiternde Volumenverteilung
- Geld verschwindet vom Markt.
- Ende der großen Kursbewegungen.
- Preiskorrekturen oder Umkehrungen.
Parameter
- Periode - aktuelle oder benutzerdefinierte Periode.
- Höhe in % - Größe des Indikatorfensters in Prozent der Charthöhe.
- Höhe in Pixeln - Mindestgröße des Indikatorfensters in Pixeln.
- Verbundene Balken - Anzeige der Balken ohne Leerzeichen, um das Auge zu schonen.

Very good indicator to read intraday price action.