DSZ Mini Charts
- Indikatoren
- Version: 1.2
- Aktualisiert: 1 Juli 2016
- Aktivierungen: 10

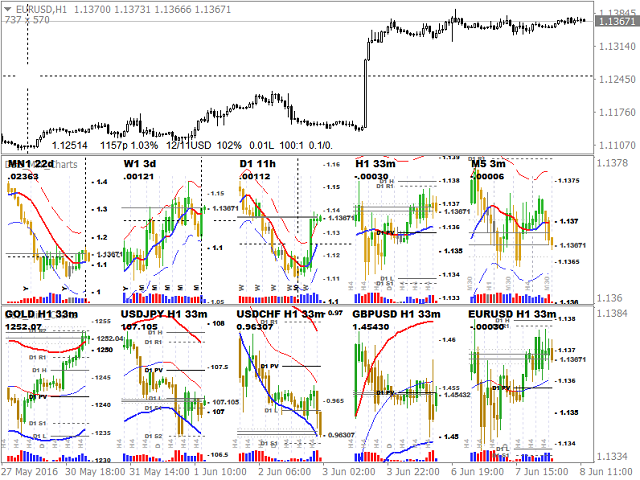
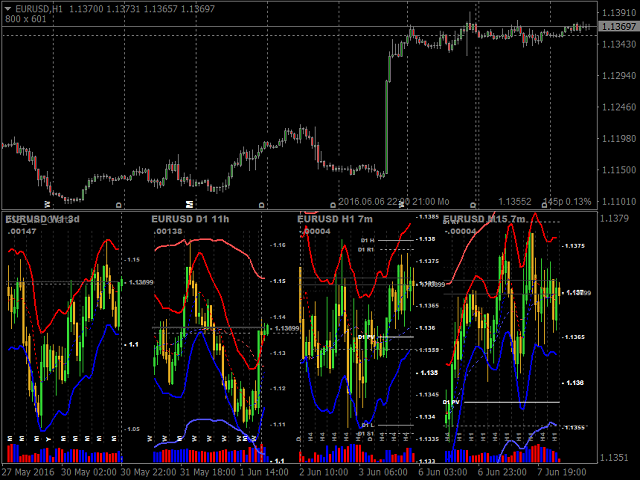
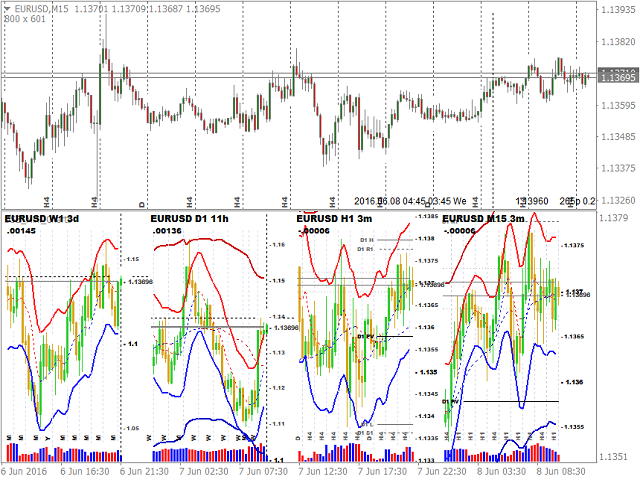
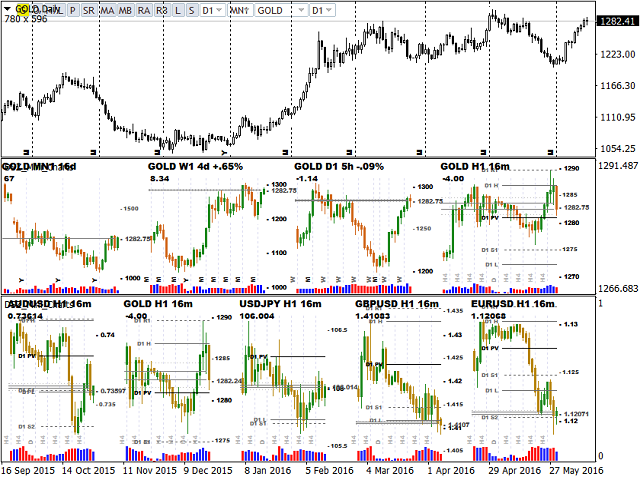
Dieser Indikator zeigt ein Balkendiagramm für eine beliebige Zeitspanne und ein beliebiges Symbol an. Er ermöglicht die Umsetzung eines "Top-Down"-Investitionsansatzes.
Die Charts verfügen über zahlreiche Funktionen, darunter einzigartige statistische Bänder, gerundete Zahlen, Pivots, Zählung der verstrichenen Zeit, Informationen über Aufträge, Änderung des Charts durch Anklicken, Speichern und Laden von Grafikobjekten und vieles mehr.
Schlüssel-Futures
- Bis zu 9 Charts pro Zeile.
- Unbegrenzte Anzahl von Instanzen.
- Symbol und Zeitrahmen frei einstellbar für jeden Chart.
- Gleitende Durchschnitte, die eine einzigartige Berechnungsmethode haben.
- Einzigartige statistische Bänder basierend auf der statistischen Verteilung. Für Intraday-Zeitrahmen hängen die Bandbreiten von der Tageszeit ab.
- Pivot Unterstützungs- und Widerstandsniveaus.
- Gerundete Zahlen, die für jeden Chart optimiert sind.
- Periodentrenner und Zählung der verstrichenen Zeit.
- Mausverfolgung - ermöglicht die Synchronisation von Zeit und Geld auf den Charts.
- Schneller Betrieb durch Caching.
- Volumen-Informationen .
- Farbschemata für den Preis und das Volumen.
- Bestellinformationen in einfachem Format.
- Stile und Farben.
- Wechsel des Hauptdiagrammsymbols und der Periode durch Anklicken.
- Speichern/Laden von Objekten ermöglicht das Wechseln von benutzerdefinierten Objekten, während das Hauptchartsymbol geändert wird.
Eingaben
- Alle haben selbstbeschreibende Namen.
- Parameter im Abschnitt "Alle Diagramme" überschreibt die Werte für einzelne Diagramme. Diese Einstellung ermöglicht es, für jedes Diagramm die gleichen Parameter zu verwenden, auch wenn sie unterschiedliche Symbole haben.
- Sichtbar - Chart aktivieren/deaktivieren.
- TF - Zeitrahmen des Charts.
- Symbol - leer (bedeutet aktuell) oder genauer Name eines anderen Symbols.
- MA & Bands TF 1 - Zeitrahmen von MA und Statistical Band 1 muss größer sein als TF.
- MA & Bands TF 2 - Zeitrahmen des MA und des statistischen Bandes 2 muss größer als TF sein.
- MA & Bands Alternate period - Anzahl der Balken, wenn keine der obigen Optionen eingestellt ist. Diese Option ist zum Beispiel für MN TF nützlich.
Während des Tests ist der Zeitrahmen auf M1 eingestellt und die Geschwindigkeit ist kleiner als das Maximum.
Der Benutzer hat keinen Kommentar hinterlassen