Standard Deviation Pivot Point
- Indikatoren
- Damien Anthony Lewis
- Version: 1.0
- Aktivierungen: 5
Der Standard Deviation Pivot Point wird Ihren Handel verbessern und großartige Handelsmöglichkeiten mit den Unterstützungs- und Widerstandsniveaus aufzeigen, die Profis auf der Grundlage der Volatilität des Marktes verwenden.
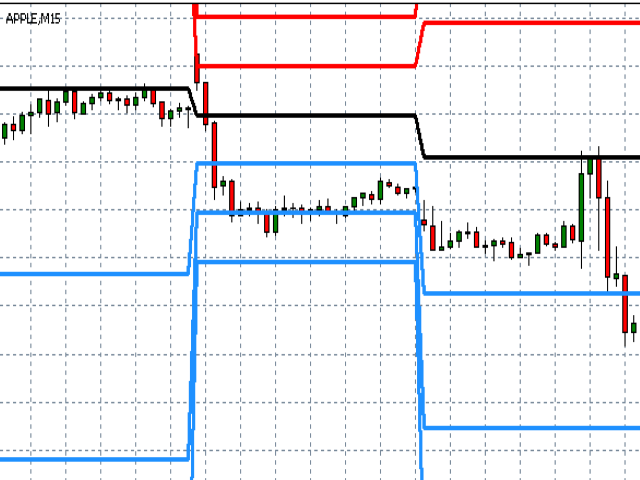
Standard Deviation Pivot Trading ist eine einfache und effektive Methode für den Einstieg und das Finden von Zielen, die statistisch gesehen auf Ihrer Seite sind. Das Hervorheben von Markt-Schlüsselebenen wird von Profis seit Jahrzehnten verwendet und ist für alle Symbole effektiv: Forex, Krypto, Aktien, Indizes.
Die Standardabweichung ist ein Maß für die Volatilität (die Tendenz zu steigen oder zu fallen) eines Marktes in einem bestimmten Zeitraum. Dieser Indikator betrachtet das Hoch, das Tief und den Schluss des Vortages, ganz ähnlich wie ein Pivot-Punkt berechnet wird, aber es gibt einige Unterschiede für die Level S1 S2 S3 R1 R2 R3, der die Abweichung berücksichtigt.
Die Statistik sagt uns, dass sich der Preis in 99% der Fälle innerhalb von 1/2/3 der Abweichung bewegen wird. Diese statistische Interpretation auf dem Chart zu haben, gibt dem Händler den Vorteil, den er braucht, indem er die Niveaus verwendet, um das Potenzial von Zielen und Zeiträumen zu bestätigen, was realistische Niveaus ergibt, die der Markt in einem bestimmten Zeitraum besuchen wird.
mit statistischen Angaben:
64,2% der Preis wird sich mit 1 Abweichung bewegen
27,4 der Preis wird sich innerhalb von 2 Abweichungen bewegen
4,6 der Preis wird sich innerhalb von 3 Abweichungen bewegen
0.2 Preis wird sich mit einer Abweichung bewegen
Mit diesen Zahlen können wir den Handel entsprechend planen und die Zeit als Variable verwenden.
Die Abweichung ist die Berechnung der Abweichung vom Mittelwert, den der Kurs in einer bestimmten Zeitspanne erreicht hat (der Mittelwert ist der Drehpunkt).
Ein Preis mit geringer Abweichung hat sich um den Mittelwert einer Spanne herum bewegt.
Ein Preis mit hoher Abweichung hat sich in einem angemessenen Abstand vom Mittelwert bewegt.
Vorteile der Standardabweichung Pivot
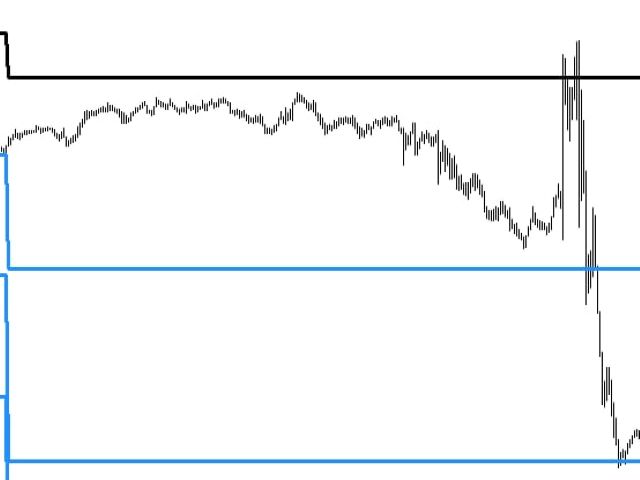
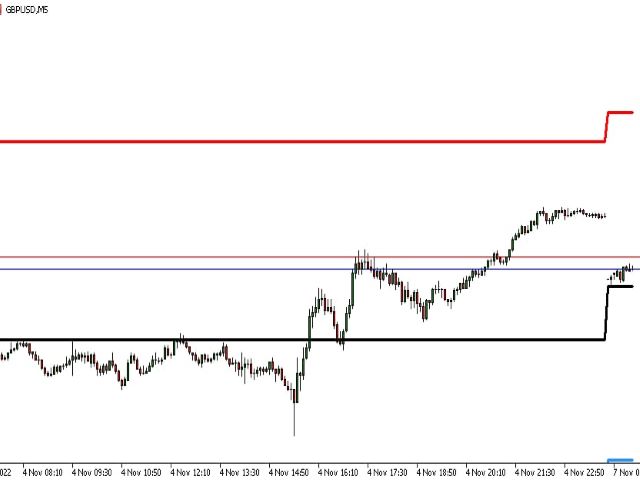
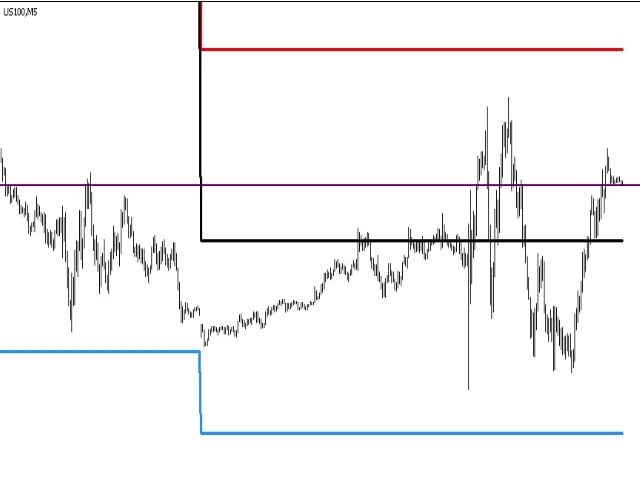
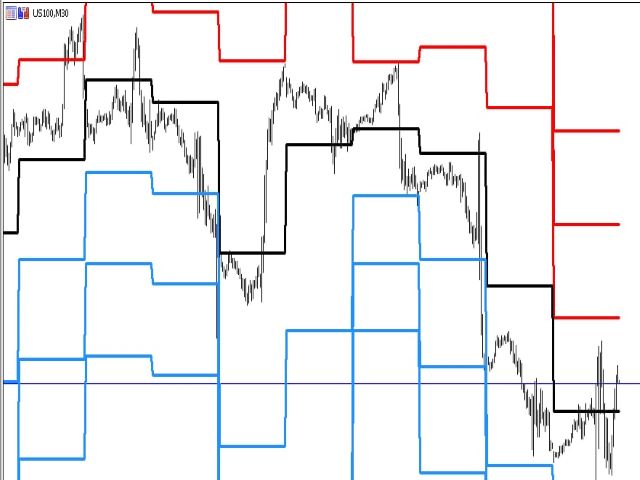
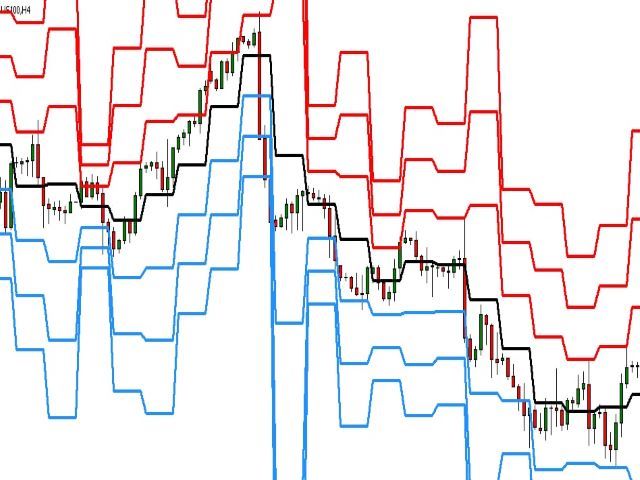
- 7 Niveaus auf dem Chart Pivot, S1, S2, S3, R1, R2, R3.
- Einfache, effektive Handelsmethode
- Identifiziert wichtige Unterstützungs- und Widerstandsniveaus des Marktes basierend auf der Volatilität in der Zeitperiode
- Visuelle Darstellung der Handelsniveaus auf Ihrem Chart (mehr als nur Pivots)
- Vollständige Historie der Levels für Backtesting-Zwecke
- Vollständig anpassbare Farben und Linienstile.
Jede Frage bitte stellen