• Übersicht
  • Bewertungen
  • Diskussion
  • Neue Funktionen

ZZVolna

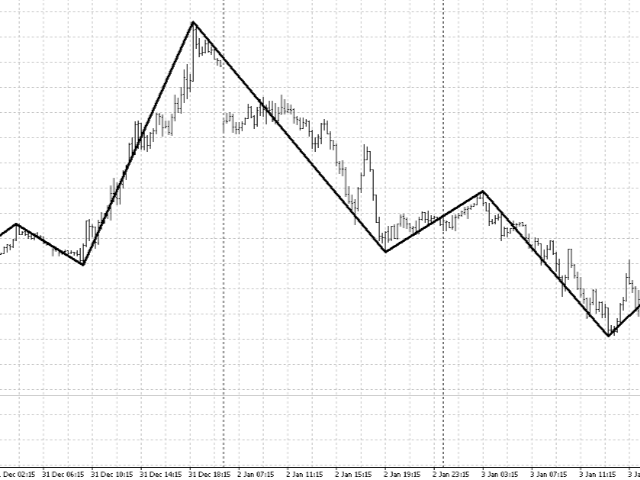
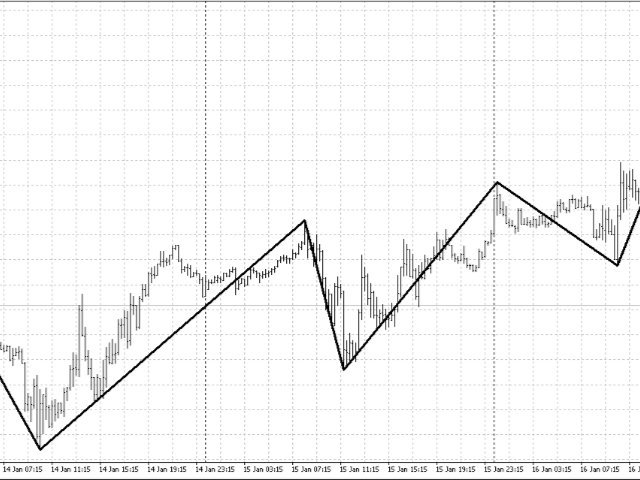
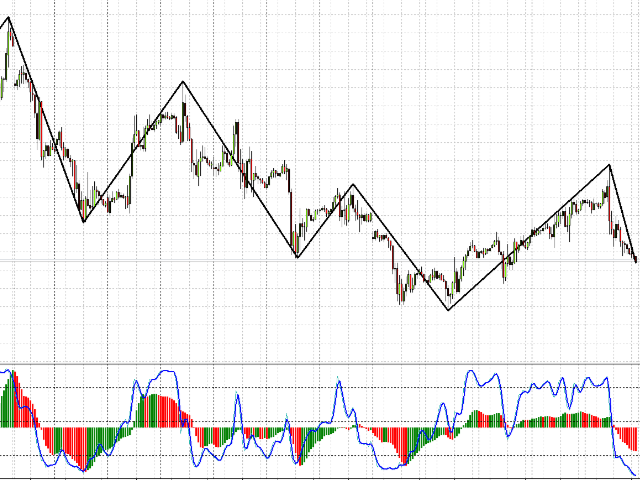
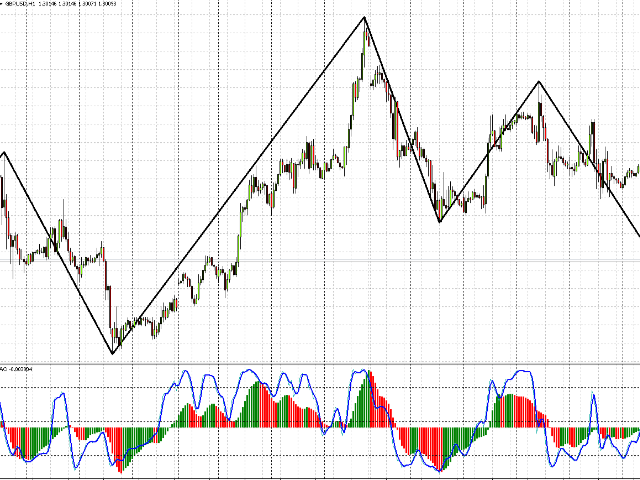
Eine weitere Version von ZigZag mit zusätzlichen Filtern zum Zeichnen und Auffinden von Gipfeln und Tiefebenen. Gut geeignet für den manuellen Handel, können Sie diese Peaks und Lowlands auch als Berater verwenden und berechnen. Auch bleiben alle Funktionen des ursprünglichen ZigZag erhalten. Zusätzliche Filter sind AO und Stochastic. Funktioniert auf allen Instrumenten und Zeitrahmen.
Empfohlene Produkte
The indicator detects and displays М. Gartley's Butterfly pattern. The pattern is plotted by the extreme values of the ZigZag indicator (included in the resources, no need to install). After detecting the pattern, the indicator notifies of that by the pop-up window, a mobile notification and an email. The pattern and wave parameters are displayed on the screenshots. The default parameters are used for demonstration purposes only in order to increase the amount of detected patterns. Parameters
Free automatic Fibonacci is an indicator that automatically plots a Fibonacci retracement based on the number of bars you select on the BarsToScan setting in the indicator. The Fibonacci is automatically updated in real time as new highest and lowest values appears amongst the selected bars. You can select which level values to be displayed in the indicator settings. You can also select the color of the levels thus enabling the trader to be able to attach the indicator several times with differe
FREE
The indicator detects and displays Shark harmonic pattern (see the screenshot). The pattern is plotted by the extreme values of the ZigZag indicator (included in the resources, no need to install). After detecting the pattern, the indicator notifies of that by a pop-up window, a mobile notification and an email. The indicator highlights the process of the pattern formation and not just the complete pattern. In the former case, it is displayed in the contour triangles. After the pattern is comple
TrendPlus
Sivakumar Subbaiya
4.21 (14)
Trend Plus   Trendplus  Indicator   Time Frame: Suitable for any time frame.  Purpose: Trend Prediction. Blue and red candle indicate the buy and sell call respectively. Buy: When the blue candle is formed buy call is initiated. close the buy trades when the next red candle will formed.   Sell: When the Red candle is formed Sell call is initiated. close the Sell trades when the next blue candle will formed.   Happy trade!!
FREE
Follow The Line
Oliver Gideon Amofa Appiah
4 (13)
FOLLOW THE LINE GET THE FULL VERSION HERE: https://www.mql5.com/en/market/product/36024 This indicator obeys the popular maxim that: "THE TREND IS YOUR FRIEND" It paints a GREEN line for BUY and also paints a RED line for SELL.  It gives alarms and alerts of all kinds. IT DOES NOT REPAINT and can be used for all currency pairs and timeframes. Yes, as easy and simple as that. Even a newbie can use it to make great and reliable trades. NB: For best results, get my other premium indicators for more
FREE
Der Trendfänger: Die Strategie des Trendfängers mit Alarmindikator ist ein vielseitiges technisches Analysewerkzeug, das Händlern hilft, Markttrends und potenzielle Ein- und Ausstiegspunkte zu identifizieren. Sie verfügt über eine dynamische Trendfängerstrategie, die sich den Marktbedingungen anpasst, um eine klare visuelle Darstellung der Trendrichtung zu ermöglichen. Händler können die Parameter an ihre Vorlieben und Risikotoleranz anpassen. Der Indikator hilft bei der Trendidentifikation,
FREE
PZ Penta O MT4
PZ TRADING SLU
2.25 (4)
The Penta-O is a 6-point retracement harmonacci pattern which usually precedes big market movements. Penta-O patterns can expand and repaint quite a bit. To make things easier this indicator implements a twist: it waits for a donchian breakout in the right direction before signaling the trade. The end result is an otherwise repainting indicator with a very reliable trading signal. The donchian breakout period is entered as an input. [ Installation Guide | Update Guide | Troubleshooting | FAQ | A
FREE
Wise Men Indicator demo
Bohdan Kasyanenko
3.67 (3)
The indicator displays signals according to the strategy of Bill Williams on the chart. Demo version of the indicator has the same features as the paid, except that it can work only on a demo account . Signal "First Wise Man" is formed when there is a divergent bar with angulation.  Bullish divergent bar - with lower minimum and closing price in the upper half. Bearish divergent bar - higher maximum and the closing price at the bottom half. Angulation is formed when all three lines of Alligat
FREE
COG LR Osc AM
Andriy Matviyevs'kyy
The presented indicator allows you to determine potential entry points into the market and set protective orders at reasonable levels. This product can be useful for both beginners and experienced traders. The indicator is based on calculation methods proven by time and practicing traders. The indicator is calculated in two stages: At the first stage, linear regression (LR) of the selected price type is determined for a given number of chart periods. At the second stage, the obtained data is p
Trend Ray
Andriy Sydoruk
The indicator shows the potential trend direction by cyclical-wave dependence. Thus, all the rays of the intersection will be optimal rays, in the direction of which the price is expected to move, taking into account the indicator period. Rays can be used as a direction for potential market movement. But we must not forget that the approach must be comprehensive, the indicator signals require additional information to enter the market.
SuperTrend V
Muhammad Hassaan
5 (1)
*This is TradingView indicator converted to mql4* The SuperTrend V indicator is a popular technical analysis tool used to identify trends and potential trend reversals in financial markets. It is based on the concept of the SuperTrend indicator but incorporates additional features and variations. The SuperTrend V indicator uses a combination of price action and volatility to determine the trend direction and generate trading signals. Here are the key components and features of the indicator:
FREE
OrderBlock TS Roman
Vladislav Vlastovskii
4 (7)
Индикатор строит блоки заказов (БЗ) по торговой системе (ТС) Романа. Поиск блоков осуществляется одновременно на двух таймфремах: текущем и старшем (определяемым в настройках). Для оптимизации и игнорирования устаревших блоков в настройках задается ограничение количества дней в пределах которых осуществляется поиск блоков. Блоки строятся по правилам ТС состоящем из трех шагов: какую свечу вынесли (что?); какой свечой вынесли (чем?); правило отрисовки (как?).
FREE
Vanexio
Sayan Vandenhout
VANEXIO USES THE TREND WAVE INDICATOR AND IT CAN IDENTIFY THE BEGINNING AND THE END OF A NEW WAVE TREND MOVEMENT. AS AN OSCILLATOR, THE INDICATOR IDENTIFIES THE OVERBOUGHT AND OVERSOLD ZONES. IT WORKS GREAT TO CATCH THE SHORT TERM PRICE REVERSALS AND USES A MARTINGALE STRATEGY TO CLOSE ALL TRADES IN PROFIT. USE DEFAULT SETTINGS ON H1 OR HIGHER TIME FRAME ON ANY PAIR FOR MORE ACCURATE TRADES WHY THIS EA : Smart entries calculated by 5 great strategies The EA can be run on even a $20000
FREE
Ichimoku Signals Scanner This is the Demo version, please download Full version  here. Find Ichimoku signals as easy as you can. Ichimoku is one of the most powerful trends recognition indicators. And it has valid signals for the trades. This indicator scans several symbols and time-frames by the Ichimoku to find all the signals that you want and show in a dashboard. It's easy to use, just drag it onto the chart. It's better to add  Ichimoku indicator  to chart before adding this indicator. Ichi
FREE
Two Period RSI
Libertas LLC
4.5 (8)
Two Period RSI compares long-term and short-term RSI lines, and plots a fill between them for improved visualization. Fill is colored differently according to an uptrend (short period RSI above long period RSI) or a downtrend (short period RSI below long period RSI). Short-term RSI crossing long-term RSI adds a more robust trend confirmation signal than using single period RSI alone. This is a small tool to help visualize and confirm RSI trends. We hope you enjoy! Looking for RSI alerts? You can
FREE
Zigzag Extremum points
Oleg Popov
4.81 (32)
New version 8.00 is available. In this version, I tried to take into account the wishes of the user. Each of you can also take part in the improvement of this advisor. In the default settings, the adviser opens trades when the extremum point is broken       standard indicator       Zigzag. When the upper point of the zigzag extremum is broken, it opens a buy deal, and when the lower point of the zigzag extremum is broken, it opens a sell deal. In addition to the standard ZigZag indicator, whi
FREE
Market Profile 3
Hussien Abdeltwab Hussien Ryad
4 (4)
Market Profile 3 MetaTrader 4 indicator  — is a classic Market Profile implementation that can show the price density over time, outlining the most important price levels, value area, and control value of a given trading session. This indicator can be attached to timeframes between M1 and D1 and will show the Market Profile for daily, weekly, monthly, or even intraday sessions. Lower timeframes offer higher precision. Higher timeframes are recommended for better visibility. It is also possible t
FREE
Extremum Reverse Bar
Yurij Izyumov
3.55 (11)
This indicator has been created for finding the probable reversal points of the symbol price. A small candlestick reversal pattern is used it its operation in conjunction with a filter of extremums. The indicator is not redrawn! If the extremum filter is disabled, the indicator shows all points that have a pattern. If the extremum filter is enabled, the condition works – if the history Previous bars 1 candles back contains higher candles and they are farther than the Previous bars 2 candle, such
FREE
The indicator detects and displays 3 Drives harmonic pattern (see the screenshot). The pattern is plotted by the extreme values of the ZigZag indicator (included in the resources, no need to install). After detecting the pattern, the indicator notifies of that by a pop-up window, a mobile notification and an email. The indicator highlights the process of the pattern formation and not just the complete pattern. In the former case, it is displayed in the contour triangles. After the pattern is com
HMA Trend
Pavel Zamoshnikov
4.6 (80)
A trend indicator based on the Hull Moving Average (HMA) with two periods. The Hull Moving Average is an improved variant of the moving average, which shows the moment of trend reversal quite accurately. It is often used as a signal filter. Combination of two types of Hull Moving Averages makes a better use of these advantages: HMA with a slow period identifies the trend, while HMA with a fast period determines the short-term movements and signals in the trend direction. Features The movement
FREE
Traditional MACD MT4
Daniel Lewis
4.59 (69)
MACD indicator in MetaTrader 4/5 looks different than MACD does in most other charting software. That is because the MetaTrader 4/5 version of MACD displays the MACD line as a histogram when it is traditionally displayed as a line. Additionally, the MetaTrader 4/5 version computes the Signal line using an SMA, while according to MACD definition it is supposed to be an EMA. The MetaTrader 4/5 version also does not compute a true MACD Histogram (the difference between the MACD/Signal lines). This
FREE
High Low Open Close MT4
Alexandre Borela
4.81 (21)
Wenn Sie dieses Projekt mögen, hinterlassen Sie eine 5-Sterne-Bewertung. Folgen Sie instagram: borelatech Dieser Indikator zieht die offenen, hohen, niedrigen und schließenden Preise für die angegebenen und kann für eine bestimmte Zeitzone eingestellt werden. Dies sind wichtige Ebenen, die von vielen institutionellen und professionellen Händler und kann nützlich sein, um die Orte, wo sie vielleicht mehr aktiv. Die verfügbaren Zeiträume sind: Vorheriger Tag. Vorherige Woche. Vorheriger Monat
FREE
Wicks UpDown Target GJ Wicks UpDown Target GJ is specialized in GJ forex pairs. Choppy movement up and down on the opening range every day.  Trading breakouts on London session and New York session is recommended. Guideline Entry Strategy Idea: Step 1 - Breakout Forming (Warning! Trade on London Session and New York Session) Step 2 - Breakout Starting (Take Action on your trading plan) Step 3 - Partial Close your order & set breakeven (no-risk) Step 4 - Target complete Step 5 - Don't tr
FREE
Basierend auf MACD-Indikatorwellen mit Standardparametern Wendet Fibonacci-Werte auf die letzten beiden MACD-Wellen an, jeweils positiv und negativ, wenn der MACD-Indikator im Moment keine negative Welle mehr hat - die Farbe ist grün, wenn der MACD-Indikator im Moment keine positive Welle mehr hat - die Farbe ist rot. Das Wave-Abschlusskriterium sind zwei Ticks mit unterschiedlichem MACD-Zeichen. Wendet Trendlinien auf die letzten vier MACD-Wellen an. Arbeitet gut mit dem Experten zus
Trend arrow Indicator
NGUYEN NGHIEM DUY
3.23 (13)
Trend arrow Indicator is an arrow Indicator used as an assistant tool for your trading strategy. The indicator analyzes the standard deviation of bar close for a given period and generates a buy or sell signals if the deviation increases. It good to combo with Martingale EA to follow Trend and Sellect Buy Only/Sell Only for EA work Semi-Automatic. You can use this  Indicator with any EAs in my Products.
FREE
Trend PA
Mikhail Nazarenko
5 (3)
The Trend PA indicator uses   Price Action   and its own filtering algorithm to determine the trend. This approach helps to accurately determine entry points and the current trend on any timeframe. The indicator uses its own algorithm for analyzing price changes and Price Action. Which gives you the advantage of recognizing, without delay, a new nascent trend with fewer false positives. Trend filtering conditions can be selected in the settings individually for your trading style. The indicator
RSX Signal 2 AM
Andriy Matviyevs'kyy
The indicator displays the signals of the RSX oscillator on the price chart. (To display these signals in a separate window, along with the oscillator, another indicator is used -  RSX Osc 4 AM ). It is optimal to use the indicator signals as signals to open a trade when the price overcomes the maximum or minimum of the bar at which the signal was given. An opposite signal cancels the previous signal. Settings: Data period for indicator calculation - data period for indicator calculation; Data
FREE
This indicator shows the latest untouched support and resistance as horizontal lines. The indicator can show support/resistance from higher timeframes. With this indicator you can e.g. easily see the support/resistance of the timeframes H4, D1 and W1 on a H1 chart, which can be a big advantage while time your entry on H1. This is the FREE version of the indicator: Support Resistance Multi Time Frame The free version works only on EURUSD and GBPUSD! Parameters referenceTF: the timeframe from wh
FREE
Wave Reversal Indicator - determines the direction of trend waves and price reversals. The indicator shows wave movements and trend directions. It gives recommendations where to follow the trader, helps to follow the trading strategy. It is an addition to an intraday or medium-term strategy. Almost all parameters are selected for each time frame and are changed automatically, the only parameter for manual adjustment is the wavelength. Works on various trading instruments and timeframes, rec
FREE
Tipu Heikin Ashi Panel
Kaleem Haider
4.56 (25)
Tipu Heikin-Ashi Panel is the modified version of the original Heiken Ashi indicator published by MetaQuotes here . A professional version of this indicator is available here . Features An easy to use Panel that shows the Heiken Ashi trend of selected timeframe. Customizable Buy/Sell alerts, push alerts, email alerts, or visual on-screen alerts. Customizable Panel. The panel can be moved to any place on the chart or minimized to allow more space. Heikin means "the average", and Ashi means "foo
FREE
Käufer dieses Produkts erwarben auch
Gann Made Easy
Oleg Rodin
4.92 (53)
Gann Made Easy ist ein professionelles und einfach zu bedienendes Forex-Handelssystem, das auf den besten Handelsprinzipien unter Verwendung der Theorie von Mr. basiert. W.D. Gann. Der Indikator liefert genaue KAUF- und VERKAUFSsignale, einschließlich Stop-Loss- und Take-Profit-Levels. Mit PUSH-Benachrichtigungen können Sie auch unterwegs handeln. Bitte kontaktieren Sie mich nach dem Kauf! Ich werde meine Handelstipps und tolle Bonusindikatoren kostenlos mit Ihnen teilen! Wahrscheinlich haben Si
DERZEIT 26% RABATT Die beste Lösung für jeden Newbie oder Expert Trader! Dieser Indikator ist ein einzigartiges, qualitativ hochwertiges und erschwingliches Trading-Tool, da wir eine Reihe von proprietären Funktionen und eine neue Formel integriert haben. Mit nur EINEM Chart können Sie die Währungsstärke für 28 Forex-Paare ablesen! Stellen Sie sich vor, wie sich Ihr Handel verbessern wird, weil Sie in der Lage sind, den genauen Auslösungspunkt eines neuen Trends oder einer Scalping-Gelegenh
Atomic Analyst
Issam Kassas
5 (3)
Zunächst einmal ist es erwähnenswert, dass dieser Handelsindikator nicht neu malt, nicht neu zeichnet und keine Verzögerung aufweist, was ihn sowohl für manuellen als auch für Roboterhandel ideal macht. Der Atom-Analyst ist ein PA-Preisaktionsindikator, der die Stärke und das Momentum des Preises nutzt, um einen besseren Vorteil auf dem Markt zu finden. Ausgestattet mit fortschrittlichen Filtern, die helfen, Rauschen und falsche Signale zu entfernen, und das Handelspotenzial zu erhöhen. Durch
TPSproTREND PrO
Roman Podpora
5 (15)
TPSpro TRENDPRO  - is a trend indicator that automatically analyzes the market and provides information about the trend and each of its changes, as well as giving signals for entering trades without redrawing! The indicator uses each candle, analyzing them separately. referring to different impulses - up or down impulse. Exact entry points into transactions for currencies, crypto, metals, stocks, indices!  -  Version MT5               DETAILED DESCRIPTION        /       TRADING SETUPS           
TPSpro RFI Levels
Roman Podpora
5 (13)
A key element in trading is zones or levels from which decisions to buy or sell a trading instrument are made. Despite attempts by major players to conceal their presence in the market, they inevitably leave traces. Our task was to learn how to identify these traces and interpret them correctly. Reversal First Impulse levels (RFI)   -  Version MT5                INSTRUCTIONS                 RUS                 ENG                                       R ecommended to use with an indicator   -  
Scalper Vault
Oleg Rodin
5 (27)
Scalper Vault ist ein professionelles Scalping-System, das Ihnen alles bietet, was Sie für erfolgreiches Scalping benötigen. Dieser Indikator ist ein komplettes Handelssystem, das von Forex- und Binäroptionshändlern verwendet werden kann. Der empfohlene Zeitrahmen ist M5. Das System liefert Ihnen genaue Pfeilsignale in Richtung des Trends. Es liefert Ihnen auch Top- und Bottom-Signale und Gann-Marktniveaus. Die Indikatoren bieten alle Arten von Warnungen, einschließlich PUSH-Benachrichtigungen.
Zunächst einmal ist es wichtig zu betonen, dass dieses Handelstool ein Nicht-Repaint-, Nicht-Redraw- und Nicht-Verzögerungsindikator ist, was es ideal für professionelles Trading macht. Der Smart Price Action Concepts Indikator ist ein sehr leistungsstarkes Werkzeug sowohl für neue als auch erfahrene Händler. Er vereint mehr als 20 nützliche Indikatoren in einem und kombiniert fortgeschrittene Handelsideen wie die Analyse des Inner Circle Traders und Strategien des Smart Money Concepts. Diese
Entdecken Sie das Geheimnis des erfolgreichen Forex -Handels mit unserem benutzerdefinierten MT4 -Indikator! Haben Sie sich jemals gefragt, wie Sie Erfolg auf dem Forex -Markt erzielen können und gleichzeitig Gewinne erzielen und gleichzeitig das Risiko minimieren können? Hier ist die Antwort, nach der Sie gesucht haben! Erlauben Sie uns, unseren proprietären MT4 -Indikator vorzustellen, der Ihren Handelsansatz revolutionieren wird. Einzigartige Vielseitigkeit Unser Indikator ist speziell
FX Power MT4 NG
Daniel Stein
5 (9)
Erhalten Sie Ihr tägliches Marktupdate mit Details und Screenshots über unser Morning Briefing hier auf mql5 und auf Telegram ! FX Power MT4 NG ist die nächste Generation unseres langjährig sehr beliebten Währungsstärkemessers FX Power. Und was bietet dieser Stärkezähler der nächsten Generation? Alles, was Sie am ursprünglichen FX Power geliebt haben PLUS GOLD/XAU-Stärkeanalyse Noch präzisere Berechnungsergebnisse Individuell konfigurierbare Analysezeiträume Anpassbares Berechnungslimit für noc
Scalper Inside PRO
Alexey Minkov
4.75 (55)
SALE NOW! Limited Time Offer! An exclusive indicator that utilizes an innovative algorithm to swiftly and accurately determine the market trend. The indicator automatically calculates opening, closing, and profit levels, providing detailed trading statistics. With these features, you can choose the most appropriate trading instrument for the current market conditions. Additionally, you can easily integrate your own arrow indicators into Scalper Inside Pro to quickly evaluate their statistics and
Wir stellen vor       Quantum Trend Sniper Indicator   , der bahnbrechende MQL5-Indikator, der die Art und Weise, wie Sie Trendumkehrungen erkennen und handeln, verändert! Entwickelt von einem Team erfahrener Händler mit über 13 Jahren Handelserfahrung,       Quantum Trend Sniper-Indikator       wurde entwickelt, um Ihre Trading-Reise mit seiner innovativen Methode zur Identifizierung von Trendumkehrungen mit extrem hoher Genauigkeit auf ein neues Niveau zu heben. ***Kaufe Quantum Trend Snipe
Derzeit 20% Rabatt! Die beste Lösung für jeden Neueinsteiger oder Expert Händler! Dieses Dashboard arbeitet mit 28 Währungspaaren. Es basiert auf 2 unserer Hauptindikatoren (Advanced Currency Strength 28 und Advanced Currency Impulse). Es bietet einen hervorragenden Überblick über den gesamten Forex-Markt. Es zeigt die Werte der Advanced Currency Strength, die Veränderungsrate der Währungen und die Signale für 28 Devisenpaare in allen (9) Zeitrahmen. Stellen Sie sich vor, wie sich Ihr Hande
Trend Screener
STE S.S.COMPANY
4.83 (86)
Trendindikator, bahnbrechende, einzigartige Lösung für Trendhandel und -filterung mit allen wichtigen Trendfunktionen in einem Tool! Es handelt sich um einen 100 % nicht neu zu malenden Multi-Timeframe- und Multi-Währungs-Indikator, der für alle Symbole/Instrumente verwendet werden kann: Forex, Rohstoffe, Kryptowährungen, Indizes und Aktien. Trend Screener ist ein effizienter Trendfolgeindikator, der Pfeiltrendsignale mit Punkten im Diagramm liefert. Die Funktionen, die im Trendanalysator-Indika
Break and Retest
Mohamed Hassan
5 (7)
‍You can visually backtest Break & Retest to see how it behaved in the past!     Manual guide:   Click here $65  for only 4 copies left! Next price is $120 .  This Indicator only places quality trades when the market is really in your favor with a clear break and retest. Patience is key with this price action strategy! After many months of hard work and dedication, we are extremely proud to present you our  Break and Retest price action indicator created from scratch. One of
Advanced Supply Demand
Bernhard Schweigert
4.92 (310)
Derzeit 33% Rabatt! Die beste Lösung für jeden Anfänger oder erfahrenen Händler! Dieser Indikator ist ein einzigartiges, qualitativ hochwertiges und erschwingliches Trading-Tool, da wir eine Reihe von proprietären Funktionen und eine neue Formel integriert haben. Mit diesem Update werden Sie in der Lage sein, doppelte Zeitrahmenzonen anzuzeigen. Sie können nicht nur einen höheren TF (Zeitrahmen) anzeigen, sondern sowohl den Chart-TF als auch den höheren TF: SHOWING NESTED ZONES. Alle Supply Dema
Werden Sie Breaker Trader und profitieren Sie von Änderungen der Marktstruktur, wenn sich der Preis umkehrt. Der Order Block Breaker Indikator zeigt an, wann sich eine Trend- oder Preisbewegung der Erschöpfung nähert und bereit ist, sich umzukehren. Es weist Sie auf Änderungen in der Marktstruktur hin, die normalerweise auftreten, wenn eine Umkehrung oder ein größerer Rückzug bevorsteht. Der Indikator verwendet eine proprietäre Berechnung, die Ausbrüche und Preisdynamik identifiziert. Jedes
Currency Strength Wizard ist ein sehr leistungsstarker Indikator, der Ihnen eine Komplettlösung für erfolgreichen Handel bietet. Der Indikator berechnet die Stärke dieses oder jenes Forex-Paares anhand der Daten aller Währungen in mehreren Zeitrahmen. Diese Daten werden in Form von benutzerfreundlichen Währungsindizes und Währungsstärkelinien dargestellt, anhand derer Sie die Stärke dieser oder jener Währung erkennen können. Sie müssen lediglich den Indikator an das Diagramm anhängen, mit dem Si
Quantum Breakout Indicator PRO
Bogdan Ion Puscasu
4.96 (26)
Wir stellen vor       Quantum Breakout PRO   , der bahnbrechende MQL5-Indikator, der die Art und Weise, wie Sie mit Breakout-Zonen handeln, verändert!   Quantum Breakout PRO   wurde von einem Team erfahrener Händler mit über 13 Jahren Handelserfahrung entwickelt und soll Ihre Handelsreise mit seiner innovativen und dynamischen Breakout-Zonen-Strategie auf ein neues Niveau bringen. Der Quantum Breakout Indicator zeigt Ihnen Signalpfeile auf Breakout-Zonen mit 5 Gewinnzielzonen und Stop-Loss
Präsentation des Miraculous Forex Indikators: Entfesseln Sie die Kraft präzisen Tradings Sind Sie es leid, nach dem besten Forex-Indikator zu suchen, der wirklich herausragende Ergebnisse in allen Zeitebenen liefert? Suchen Sie nicht weiter! Der Miraculous Forex Indikator ist da, um Ihre Trading-Erfahrung zu revolutionieren und Ihre Gewinne auf neue Höhen zu bringen. Basierend auf modernster Technologie und jahrelanger sorgfältiger Entwicklung steht der Miraculous Forex Indikator als Höhepunkt v
FX Volume
Daniel Stein
4.6 (35)
Erhalten Sie Ihr tägliches Marktupdate mit Details und Screenshots über unser Morning Briefing hier auf mql5 und auf Telegram ! FX Volume ist der ERSTE und EINZIGE Volumenindikator, der einen ECHTEN Einblick in die Marktstimmung aus Sicht eines Brokers bietet. Es bietet fantastische Einblicke in die Positionierung von institutionellen Marktteilnehmern, wie z.B. Brokern, auf dem Forex-Markt, viel schneller als COT-Berichte. Diese Informationen direkt auf Ihrem Chart zu sehen, ist der wahre Game
GOLD Impulse with Alert
Bernhard Schweigert
4.56 (9)
Dieser Indikator ist eine hervorragende Kombination aus unseren 2 Produkten Advanced Currency IMPULSE with ALERT  +   Currency Strength Exotics . Es funktioniert für alle Zeitrahmen und zeigt grafisch Impulse der Stärke oder Schwäche für die 8 wichtigsten Währungen plus ein Symbol! Dieser Indikator ist darauf spezialisiert, die Beschleunigung der Währungsstärke für beliebige Symbole wie Gold, Exotische Paare, Rohstoffe, Indizes oder Futures anzuzeigen. Als erster seiner Art kann jedes Sym
PZ Harmonacci Patterns
PZ TRADING SLU
3.43 (7)
Dies ist wahrscheinlich der vollständigste Indikator für die automatische Erkennung der harmonischen Preisbildung, den Sie für die MetaTrader-Plattform finden können. Es erkennt 19 verschiedene Muster, nimmt Fibonacci-Projektionen genauso ernst wie Sie, zeigt die potenzielle Umkehrzone (PRZ) an und findet geeignete Stop-Loss- und Take-Profit-Werte. [ Installationsanleitung | Update-Anleitung | Fehlerbehebung | FAQ | Alle Produkte ] Es erkennt 19 verschiedene harmonische Preisbildungen Dar
Price Action Entry Alerts
Stephen Sanjeeve Sahayam
5 (3)
Dieser Indikator überprüft jeden Balken auf Kauf- oder Verkaufsdruck und identifiziert 4 Arten von Kerzenmustern mit dem höchsten Volumen. Diese Kerzen werden dann mithilfe mehrerer linearer Filter gefiltert, um Kauf- oder Verkaufssignale anzuzeigen. Signale funktionieren am besten in Verbindung mit einer höheren Zeitrahmenrichtung und wenn sie während der Stunden mit hohem Handelsvolumen gehandelt werden. Alle Filter sind anpassbar und funktionieren unabhängig voneinander. Kann Signale einer e
TrendMaestro
Stefano Frisetti
5 (2)
note: this indicator is for METATRADER4, if you want the version for METATRADER5 this is the link: TRENDMAESTRO recognizes a new TREND in the bud, he never makes mistakes. The certainty of identifying a new TREND is priceless. DESCRIPTION TRENDMAESTRO identifies a new TREND in the bud, this indicator examines the volatility, volumes and momentum to identify the moment in which there is an explosion of one or more of these data and therefore the moment in which prices have strong probability of f
Dieses Dashboard ist ein Warntool zur Verwendung mit dem Indikator für die Umkehrung der Marktstruktur. Sein Hauptzweck besteht darin, Sie auf Umkehrmöglichkeiten in bestimmten Zeitrahmen und auch auf die erneuten Tests der Warnungen (Bestätigung) aufmerksam zu machen, wie es der Indikator tut. Das Dashboard ist so konzipiert, dass es auf einem eigenen Chart sitzt und im Hintergrund arbeitet, um Ihnen Benachrichtigungen zu Ihren ausgewählten Paaren und Zeitrahmen zu senden. Es wurde entwickelt,
Indicator : RealValueIndicator Description : RealValueIndicator is a powerful tool designed specifically for trading on the EURUSD pair. This indicator analyzes all EUR and USD pairs, calculates their real currency strength values, and displays them as a single realistic value to give you a head start on price. This indicator will tell you moves before they happen if you use it right. RealValueIndicator allows you to get a quick and accurate overview of the EURUSD currency pair tops and bottoms,
TrendDecoder Premium
Christophe, Pa Trouillas
5 (3)
Identifizieren Sie Bereiche und die nächsten wahrscheinlichen Bewegungen   |  Erhalten Sie früheste Signale und die Stärke von Trends   |  Klare Ausstiegssignale vor Umkehrung   |  Erkennen Sie die Fibo-Levels, die der Kurs testen wird Indikator, der nicht zurückverfolgt, nicht verzögert - ideal für den manuellen und automatisierten Trading - geeignet für alle Vermögenswerte und Zeiteinheiten Zeitlich begrenztes Angebot   >> 50% OFF Nach dem Kauf,   bitte kontaktieren Sie mich auf diesem Kanal  
AW Trend Predictor
AW Trading Software Limited
4.74 (39)
Die Kombination von Trend- und Aufschlüsselungsebenen in einem System. Ein fortschrittlicher Indikatoralgorithmus filtert Marktrauschen, bestimmt den Trend, Einstiegspunkte sowie mögliche Ausstiegsniveaus. Indikatorsignale werden in einem Statistikmodul aufgezeichnet, das es Ihnen ermöglicht, die am besten geeigneten Tools auszuwählen, die die Wirksamkeit der Signalhistorie zeigen. Der Indikator berechnet Take-Profit- und Stop-Loss-Marken. Handbuch und Anleitung ->   Hier   / MT5-Version ->   H
Zeichnen Sie automatisch Unterstützungs- und Widerstandsniveaus PLUS Antriebskerzenlücken auf Ihrem Chart ein, so dass Sie sehen können, wohin sich der Preis wahrscheinlich als Nächstes bewegen und/oder möglicherweise umkehren wird. Dieser Indikator wurde entwickelt, um als Teil der Positionshandelsmethodik verwendet zu werden, die auf meiner Website (The Market Structure Trader) gelehrt wird, und zeigt Schlüsselinformationen für die Zielsetzung und potenzielle Einstiege an. Der Indikator v
ICT, SMC, SMART MONEY CONCEPTS, SMART MONEY, Smart Money Concept, Support and Resistance, Trend Analysis, Price Action, Market Structure, Order Blocks, BOS/CHoCH,   Breaker Blocks ,  Momentum Shift,   Supply&Demand Zone/Order Blocks , Strong Imbalance, HH/LL/HL/LH,    Fair Value Gap, FVG,  Premium  &   Discount   Zones, Fibonacci Retracement, OTE, Buy Side Liquidity, Sell Side Liquidity, BSL/SSL Taken, Equal Highs & Lows, MTF Dashboard, Multiple Time Frame, BigBar, HTF OB, HTF Market Structure, 
Weitere Produkte dieses Autors
Das Skript überträgt alle offenen Bestellungen auf Breakeven, wenn ein bestimmtes Niveau erreicht ist, stoppt alle Bestellungen, wenn Sie vergessen haben, oder um beim Öffnen nicht zu baden, auch nicht bei ausstehenden Einzahlungen. Das Skript hat auch die Funktion, Aufträge zu schließen, auf der Rückseite ATS-Kerze, abhängig von der offenen Transaktion, der Wahl von M15 oder M5, oder überhaupt nicht automatisch zu schließen. 1. Die Anzahl der Anteile, für die der Orderschutz festgelegt wir
Torg FMA
ANTON IVANOV
Dieser EA ist vollautomatisch und beginnt bei MM und RM und endet mit der teilweisen Verwendung als Hilfsmittel für den manuellen Handel, da er die Funktionen des Öffnens per Algorithmus oder des Schließens per Schleppnetz für Fraktale hat. Funktioniert mit allen Werkzeugen.   1. Umrechnung verlustbehafteter Transaktionen, unabhängig von den enthaltenen Funktionen, abhängig vom angegebenen Wert, der in Abhängigkeit von der Streuung des Instruments berechnet wird.   2. Legen Sie den Take Profit f
ZigZag3
ANTON IVANOV
Zickzack mit der Signatur der letzten drei Extreme, 1., 2. und 3., der Zickzack-Indikator selbst sollte bei Bedarf zusätzlich zum Chart hinzugefügt werden, da Sie darauf verzichten können.    Es funktioniert auf allen Instrumenten und Zeitrahmen. Besonders bei großen TFs ist es nützlich, die letzten 3 Kurse sofort zu sehen und das Diagramm nicht mit unnötigen Indikatoren und Linien zu überladen. Sie können - Farbe, Schriftgröße und Position relativ zum Anhang des Preises des Diagramms ändern Dam
ZigZagABC
ANTON IVANOV
1 (1)
Dieser Indikator zeigt die letzten 4 Zickzack-Extrema an und bezeichnet sie als 0, A, B, C mit der Preisunterschrift. Es funktioniert auf jedem Handelsinstrument. Sie können die Größe, Farbe des Texts und die Position des Texts im Verhältnis zu den Höchstpreisen ändern. Sie können auch die Zick-Zack-Einstellungen selbst ändern. ZIgZag selbst zum Zeichnen von Linien muss zusätzlich mit dem Plan verbunden werden. Damit der letzte Wert immer das letzte Maximum / Minute des Zickzacks anzeigt, setzen
Der übliche Indikator ist Parabolic_Sar, aber er wird auf dem Chart nicht durch Punkte, sondern durch eine Linie angezeigt. Aufgrund dessen gibt es einen Unterschied in den Signalen, was sich sowohl positiv als auch negativ auswirken kann. In jedem Fall gilt: Je mehr Filter, desto klarer erscheint das Bild des Marktes. In dieser Anzeige wird auch ein Audiosignal ausgegeben, wenn sich die Parabelbiegung ändert und SAR-Kerzen auftreten.
ZZFlet
ANTON IVANOV
ZZFLET zeichnet eine Ebene auf die Karte, 10 min / max. Zickzack nach den ersten 3 können Sie die Farbe des Textes, die Farbe der Linien, die Schriftgröße und die Stärke der Linien ändern, die die Ebene selbst begrenzen. Der Indikator eignet sich hauptsächlich als flacher Indikator für kleinere TFs, für größere ist er ein Indikator für Unterstützungs- und Widerstandslinien. Das Rendern erfolgt nach dem üblichen Zick-Zack-Prinzip, das bei Bedarf dem Diagramm hinzugefügt werden sollte.
Auswahl:
Keine Bewertungen
Antwort auf eine Rezension
Version 1.1 2020.01.19
мелкие ошибки