MCFSIndicator
- Indikatoren
- Version: 1.4
- Aktualisiert: 1 März 2022
- Aktivierungen: 5

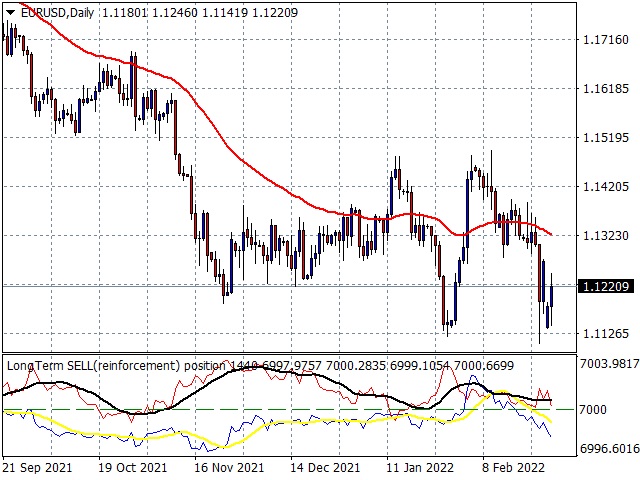
Indikator, der die Stärke der wichtigsten Währungen gegenüber anderen Währungen misst.
Wenn die Stärke einer Währung die der anderen übersteigt, ist es an der Zeit, eine Position in KAUFEN oder VERKAUFEN zu eröffnen.
Es ist möglich, die Benachrichtigungen über die Parameter zu aktivieren und die Signale direkt in die Grafik einzufügen oder nicht.
Sehr zuverlässiger Indikator, der auf dem gesamten Markt der Hauptwährungen basiert und nicht nur auf dem einzelnen Währungskreuz.