MediasCoiote
- Indikatoren
- Version: 1.1
- Aktualisiert: 24 März 2021

Die Coyote-Durchschnittswerte automatisieren das Ablesen von schnellen und langsamen Durchschnittsanalysen zum Volumen- und Preisgleichgewicht.
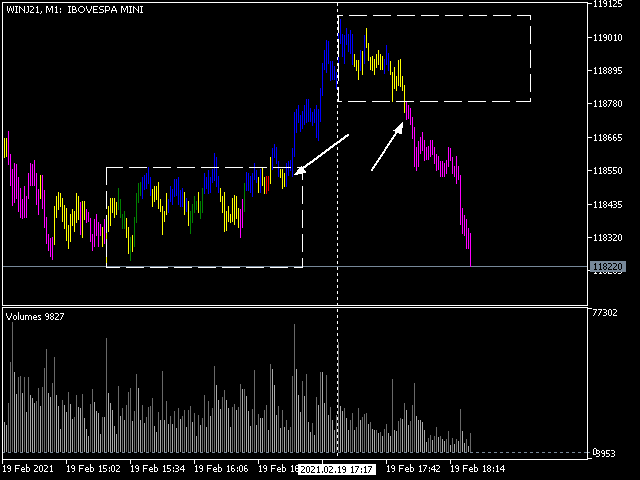
Wenn sich die Durchschnitte im Kaufmodus befinden, ist die Kerze blau gefärbt.
Wenn sich die Durchschnitte im Verkaufsmodus befinden, ist die Kerze magentafarben.
Wenn die Farbe grün oder rot wird, werden die Durchschnitte im Volumen, aber nicht im Preis genommen; wenn dies geschieht, ist es ein Warnzeichen.
Der Indikator ist für Ausstiegsgeschäfte aus Konsolidierungen in Trendrichtung gedacht.
Coyote-Durchschnittswerte funktionieren auf jedem Konto mit Real Volume und Tick Volume.
Gosto muito e recomendo!