SupplyDemandRSIStoch
- Indikatoren
- Version: 1.0
- Aktivierungen: 5
Dies ist ein Angebots-Nachfrage-Indikator, der auf Fractal, RSI und Stochastic Oscillator basiert.
Er hat sechs Deckungsoptionen, die Sie nach Bedarf einstellen können, indem Sie sie auf true oder false setzen:
------------------------
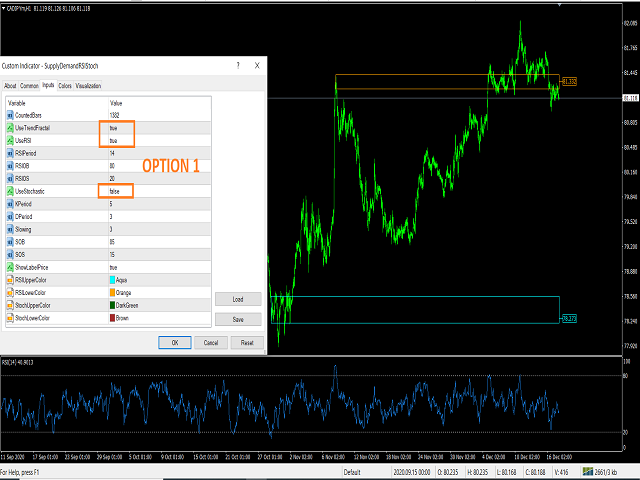
Option 1:
UseTrendFractal = true;
UseRSI = falsch;
UseStochastic = wahr;
------------------------
Option 2:
UseTrendFractal = true;
UseRSI = wahr;
UseStochastic = falsch;
------------------------
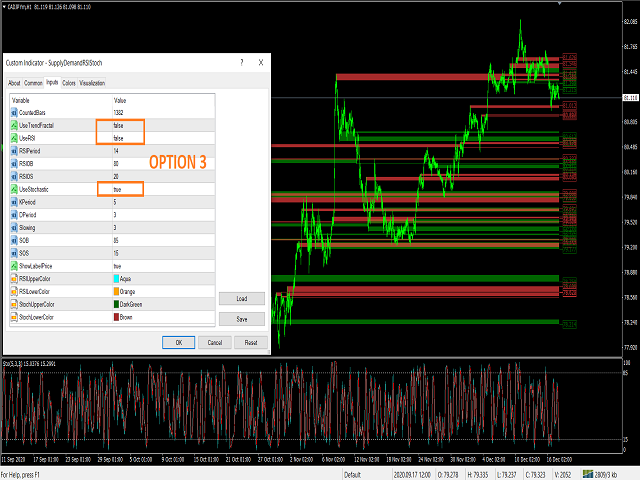
Option 3:
UseTrendFractal = false;
UseRSI = falsch;
UseStochastic = wahr;
------------------------
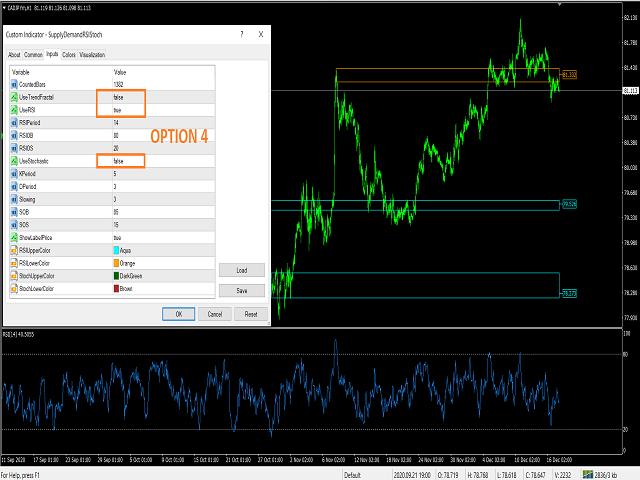
Option 4:
UseTrendFractal = false;
UseRSI = wahr;
UseStochastic = false;
------------------------
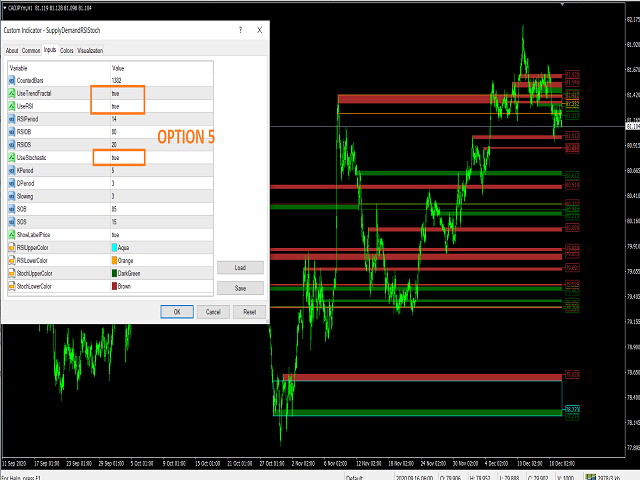
Option 5:
UseTrendFractal = true;
UseRSI = wahr;
UseStochastic = wahr;
------------------------
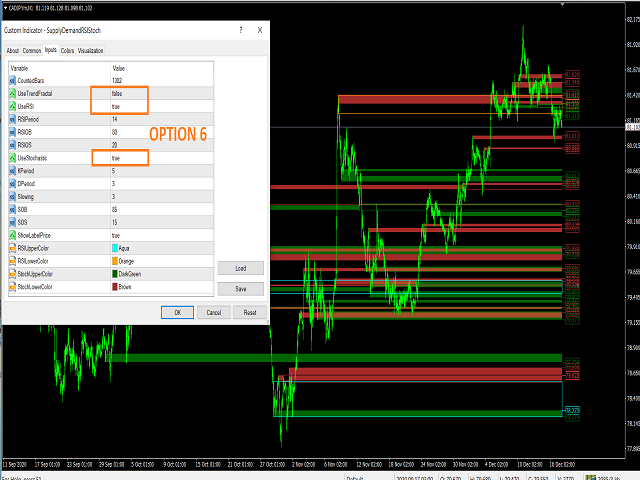
Option 6:
UseTrendFractal = false;
UseRSI = wahr;
UseStochastic = wahr;
------------------------
Wenn Sie die Preisauszeichnung nicht verwenden möchten, können Sie bei der Option ShowLabelPrice den Wert false einstellen.
Sie können das Niveau von Overbought und Oversold mit der Option anpassen:
für RSI (Einstellung RSIOB/RSIOS) und für Stochastic (SOB/SOS)
Fröhliches SnD,
Mit freundlichen Grüßen