SupplyDemandRSIStoch
- Indicadores
- Versión: 1.0
- Activaciones: 5
Este es el Indicador de Oferta y Demanda basado en Fractal, RSI y Oscilador Estocástico.
Tiene seis opción de cobertura, usted puede hacer ajustar su necesario por establecer en verdadero o falso:
------------------------
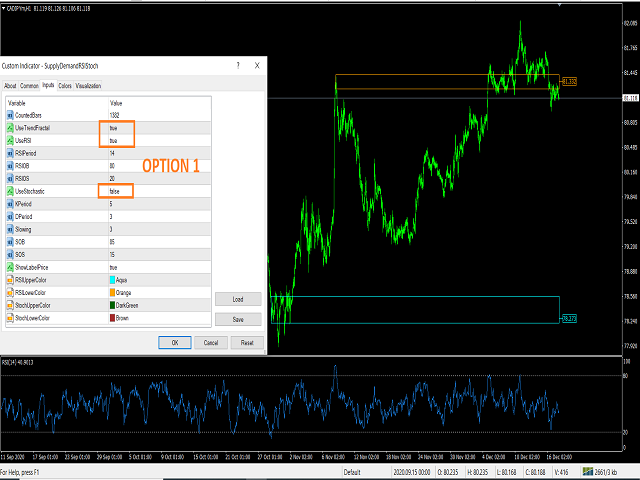
Opción 1:
UseTrendFractal = true;
UseRSI = false;
UseStochastic = true;
------------------------
Opción 2:
UseTrendFractal = true;
UseRSI = true;
UseStochastic = false;
------------------------
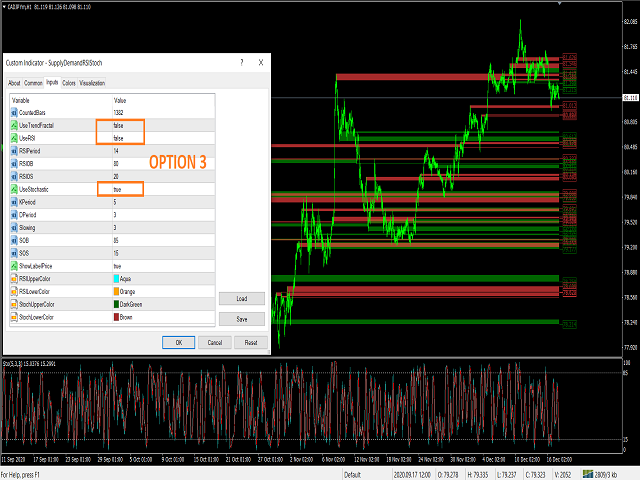
Opción 3:
UseTrendFractal = false;
UseRSI = false;
UseStochastic = true;
------------------------
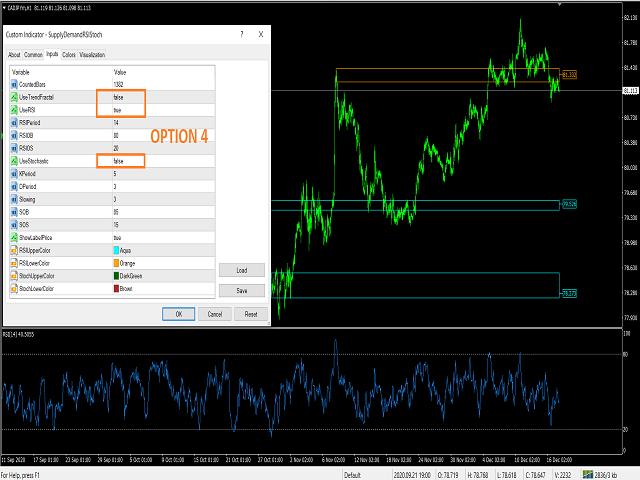
Opción 4:
UseTrendFractal = false;
UseRSI = true;
UseStochastic = false;
------------------------
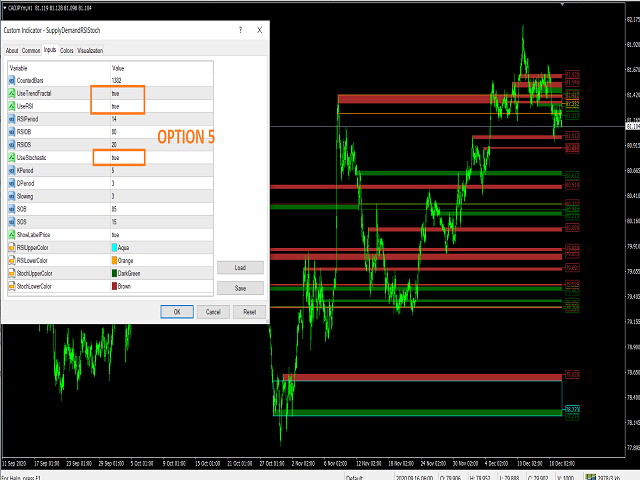
Opción 5:
UseTrendFractal = true;
UseRSI = true;
UseStochastic = true;
------------------------
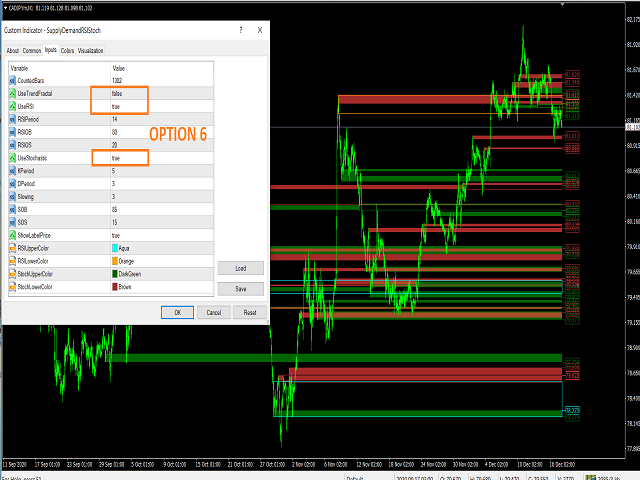
Opción 6:
UseTrendFractal = false;
UseRSI = true;
UseStochastic = true;
------------------------
Y si no desea utilizar la etiqueta de precio, puede establecer false en la opción ShowLabelPrice.
Puede ajustar el nivel de sobrecompra y sobreventa en la opción :
para RSI (ajuste RSIOB/RSIOS) y para Estocástico (SOB/SOS)
Feliz SnD,
Saludos