Polynom Moving and Channel
- Indikatoren
- Version: 1.6
- Aktualisiert: 29 März 2023
- Aktivierungen: 5

Die Verwendung einer polynomiellen Erweiterung von Daten eröffnet neue Möglichkeiten für die Analyse und Entscheidungsfindung. Das Problem aller bestehenden Algorithmen ist jedoch eine sehr langsame Berechnung.
Das Hauptmerkmal dieses Indikators ist sein schneller Algorithmus. Die Geschwindigkeit der Berechnung des Polynomalgorithmus und seiner Standardabweichungswerte ist mehrere tausend Mal schneller als bei herkömmlichen Algorithmen. Es handelt sich also um einen Algorithmus, der auch ohne den Einsatz von Supercomputern verwendet werden kann.
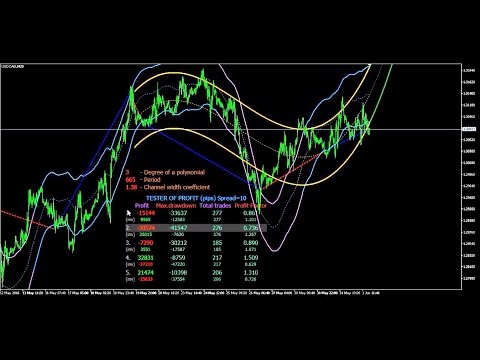
Außerdem bietet der Indikator ab Version 1.4 einen eingebauten Strategietester mit Handelsvisualisierung und gleichzeitiger Berechnung des Gewinns (in Pips), des maximalen Drawdowns (in Pips), der Gesamtzahl der Trades und des Profit Factors (Gesamtgewinn/Gesamtverlust) sowie der Anzeige dieser Daten in einer Tabelle. Es sind 10 Strategiebeispiele verfügbar: 5 Kanal- und 5 Nicht-Kanal-Strategien sowie deren Umkehrstrategien (Verkaufen und Kaufen werden umgekehrt). Die Funktionen des Testers können noch erweitert werden, indem der Indikator auf einen anderen Indikator, z.B. den RSI, angewendet wird. Um den Tester aufzurufen, drücken Sie "T" (Tester). Um eine Strategie auszuwählen, fahren Sie mit dem Mauszeiger über die Informationszeile der Strategie. Eine kurze Beschreibung der Strategie wird im Popup-Menü angezeigt. Sie können zwischen Kanal- und Nicht-Kanal-Strategien umschalten, indem Sie auf "C" (Kanal) drücken. Darüber hinaus planen wir, einen einfachen visuellen Strategiekonstruktor hinzuzufügen, der es ermöglicht, benutzerdefinierte Strategien direkt aus dem Indikatorfenster zu erstellen.
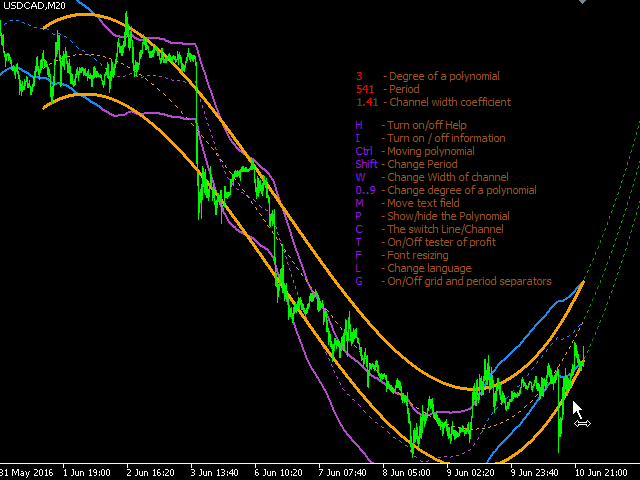
Eine weitere bemerkenswerte Funktion ist die Möglichkeit, Parameter aus dem Indikatorfenster heraus mit der Taste und der Maus zu konfigurieren. Diese Methode ist intuitiver, schneller und einfacher. Drücken Sie "H" (Hilfe), um Tipps zu den Tastenkombinationen zu erhalten, und sehen Sie sich das beigefügte Video an.
Die Sprachunterstützung wurde hinzugefügt (8 Sprachen) und soll weiter verbessert und erweitert werden. Sie können eine Sprache über das Eigenschaftsfenster oder durch Drücken von "L" (Sprache) auswählen.
Indikator-Linien
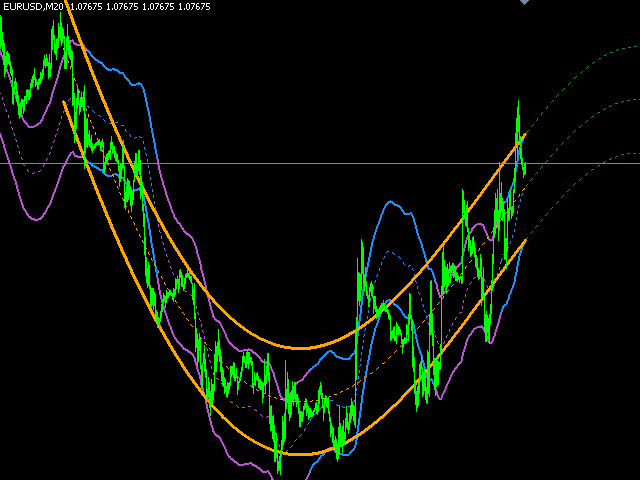
- Gelbe Linien - werden bei jedem Tick des Polynomkanals neu gezeichnet. Grün gestrichelte Linien - die polynomiale Extrapolation in die Zukunft.
- Zweifarbige Linien - nicht neu gezeichneter Kanal, Spuren eines gelben Polynoms Gelb. Die Linie ist blau, wenn die Polynomlinien nach oben gerichtet sind, lila - wenn nach unten.
- Rote Linie - Verkaufen, blaue Linie - Kaufen. Wird angezeigt, wenn der Tester eingeschaltet ist.
Indikator-Parameter
- Sprache wählen - Auswahl der Sprache
- Grad des Polynoms - 0 bis 20.
- 0 - einfaches МА (Bollinger Bands Kanal)
- 1 - lineare Regression
- 2 - nicht lineare Regression ohne Wendepunkte (Bogen)
- 3 - nichtlineare Regression mit einem Wendepunkt (Welle)
- usw.
- Anzahl der Balken für die Berechnung (Periode) .
- Breite des Kanals, 0 - kein Kanal, 1-Breite = Standardabweichung:
- 0 - kein Kanal zu zeichnen
- 1 - die Kanalbreite ist gleich der Standardabweichung des Polynoms
- Balken zur Extrapolation in die Zukunft
- Polynom anzeigen? - Polynom anzeigen/ausblenden.
- Spanne für Tester. - Wählen Sie den Spreizungswert für den Test.
Der Grad eines Polynoms ist auf 20 begrenzt, da eine höhere Anzahl von Polynomen das Problem der geringeren Genauigkeit und des Überlaufs des Maximalwerts vom Typ double verursacht, da sein Maximalwert 1,7976931348623158e+308 beträgt und die Genauigkeit 15 sinnvolle Stellen nach dem Komma beträgt. Je höher der Grad des Polynoms und seine Periode sind, desto höher ist die Wahrscheinlichkeit eines Überlaufs und der Indikator kann keine Berechnungen durchführen oder seine Daten sind falsch. Dieses Problem kann durch die Verwendung spezieller hochpräziser Bibliotheken mit dll leicht gelöst werden. Aber das ist eine andere Geschichte, und ich bin nicht sicher, ob Sie das brauchen. Meiner Meinung nach reicht es aus, den Indikator mit einem Polynomgrad unter 10 zu verwenden. Ich empfehle, diesen Wert nicht zu überschreiten, da dies die Geschwindigkeit des Indikators erheblich beeinträchtigen kann.
PS: Dieser Indikator wurde ursprünglich für MQL5 entwickelt, und seine exakte Kopie für MetaTrader 5 ist auf dem Markt erhältlich. Das beigefügte Video wurde auf der Grundlage der MetaTrader 5-Plattform erstellt. Auf MetaTrader 4 funktioniert er auf die gleiche Weise. Die einzigen Unterschiede sind, dass der MetaTrader 4 es leider nicht erlaubt, den Indikator auf der Grundlage anderer Indikatoren darzustellen, wie es im Video am Beispiel des RSI gezeigt wird. Außerdem werden im MetaTrader 5 die im Fenster geänderten Parameter beim Wechsel des Zeitrahmens gespeichert. Außerdem läuft der gleiche Code auf dem MetaTrader 5 deutlich schneller. Ich habe das Video jedoch nicht für MetaTrader 4 neu aufgenommen, da ich davon ausgehe, dass es nützlich ist, die Funktionen von MetaTrader 5 zu kennen. Ich empfehle also jedem, mit MetaTrader 5 zu arbeiten.


I really like this! It's very useful. I will eventually get the Fast Polynomial because the update looks like it allows the settings to be kept when you change time frames. It's a pain changing them every time. I still love it. I have a version made by someone else on my phone and computer but it's not as good as this one even though it has buy and sell signals. It's exactly what I was looking for. Thanks!