SnR tool
- Indikatoren
-
Syahirul Nizzam Bin Haron
 Hello everybody,
I'm ready to create any EA, indicator and script if you want to ...
Feel free to contact me ... - Version: 2.0
- Aktualisiert: 21 April 2022
- Aktivierungen: 7
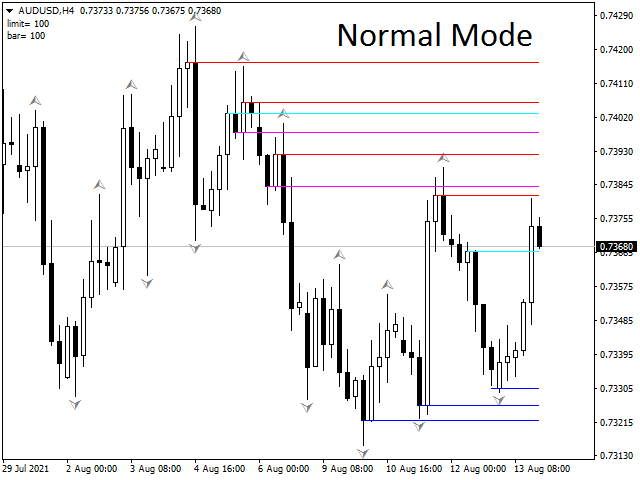
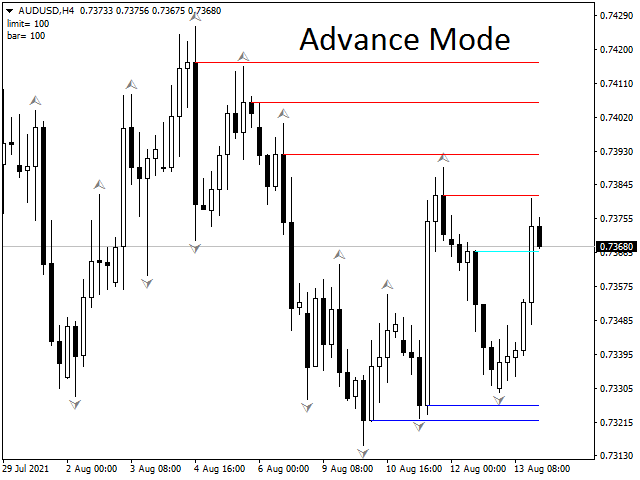
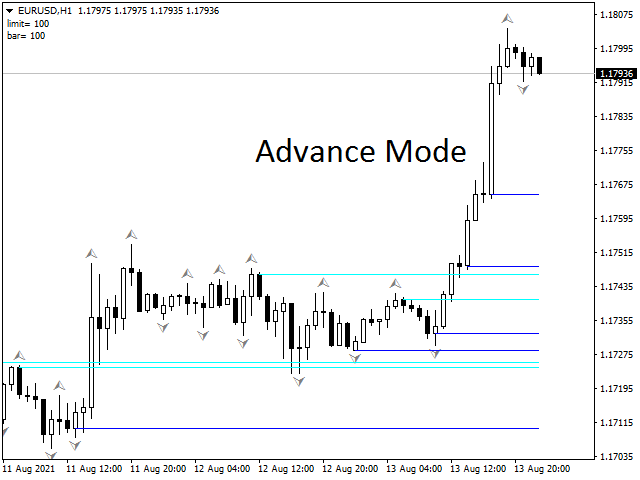
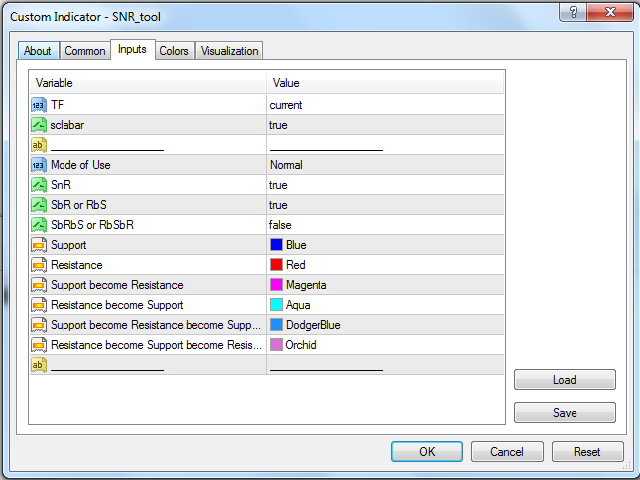
Dies ist ein SnR-Tool.
Es basiert auf dem Kerzenkörper.
Es ist ein Multi-Timeframe-Indikator.
Es gibt einen leistungsstarken Scalabar für vertikale Linien, um die Kerzenbalken zu begrenzen.
Die Farbe für jede Linie kann auch geändert werden.
Es kann Folgendes erkennen:
1. Support && Resistance
2. Unterstützung wird Widerstand && umgekehrt
3.Unterstützung wird Widerstand wird Unterstützung && umgekehrt
Es kann auch für Trading-Tools und Studien über SnR verwendet werden
*Neue Version verfügbar

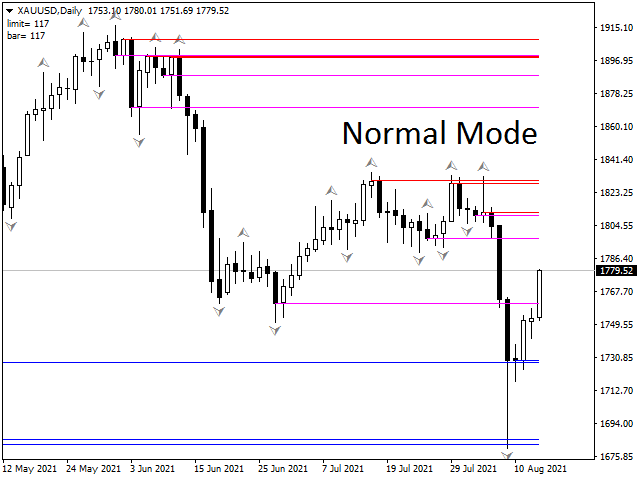


I found this tool to be an escential indicator for plotting the Support and Resistance zones and helps me to identify the "Reaction Zones" that will have major market movements. I found that the 1 Day timeframe worked best for identifying every type of SR (S,R,SbR,RbS,SbRbS,RbSbR) without creating a lot of clutter. The colors I that worked best for me (version 1.50) was S=CornflowerBlue, Resistance=Red, SbR=Magenta, RbS=Aqua, AbRFbS=Firebrick, RbSbR=SeaGreen. The only update I could see to be helpful would be to allow for the customization of the line widths. Thanks you so much for creating a fantatic indicator!