SnR tool
- Indicadores
-
Syahirul Nizzam Bin Haron
 Hello everybody,
I'm ready to create any EA, indicator and script if you want to ...
Feel free to contact me ... - Versión: 2.0
- Actualizado: 21 abril 2022
- Activaciones: 7
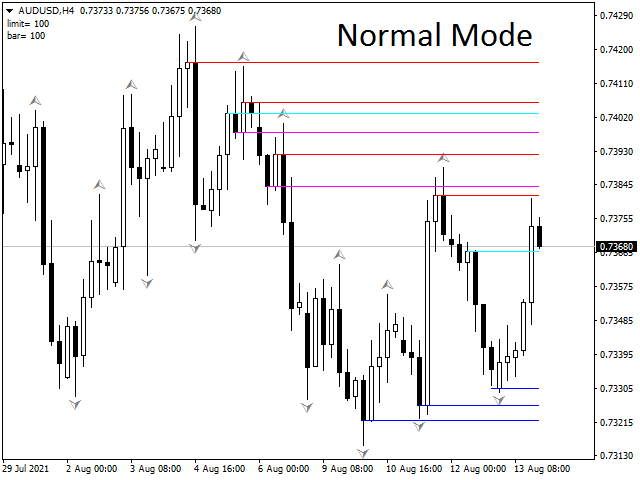
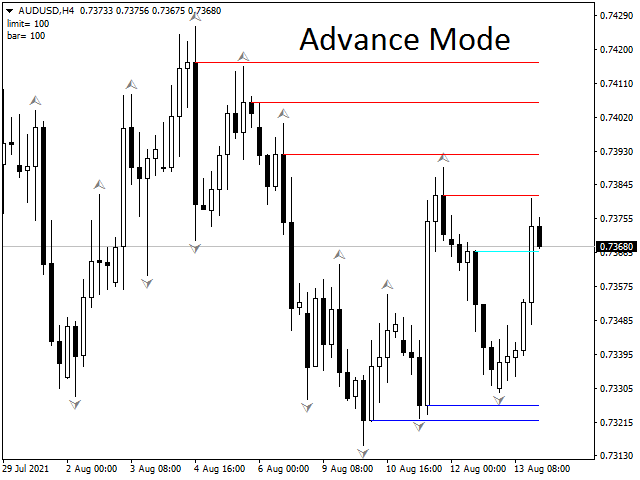
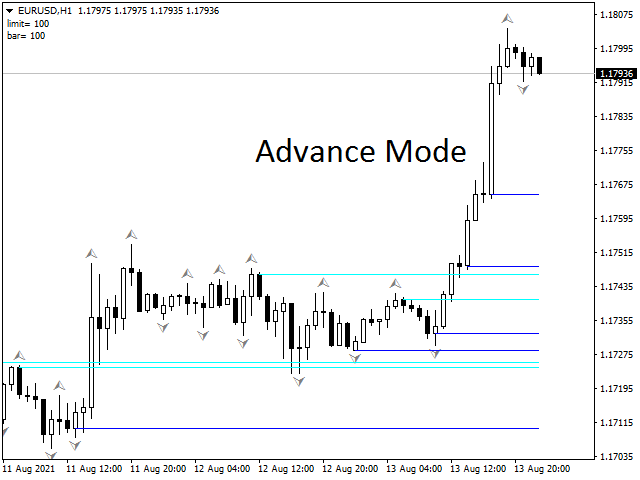
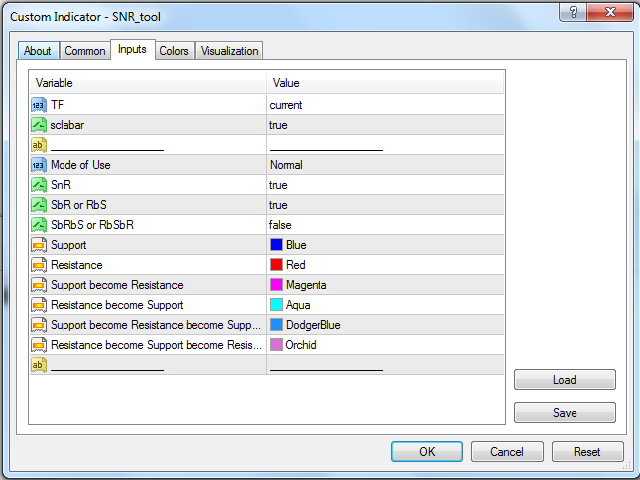
Esta es una herramienta SnR.
Está construido en base al cuerpo de la vela.
Es un indicador multi timeframe.
Hay un poderoso scalabar para deslizamientos de líneas verticales para limitar las barras de las velas.
El color para cada línea también puede ser cambiado.
Puede detectar:
1. Soporte && Resistencia
2. Soporte se convierte en Resistencia && viceversa 3. Soporte se convierte en Resistencia se convierte en Soporte && viceversa 2.Soporte se convierte en Resistencia && viceversa
3.Soporte se convierte en Resistencia se convierte en Soporte && viceversa
También se puede utilizar para las herramientas de negociación y estudios sobre SnR
*Nueva versión disponible

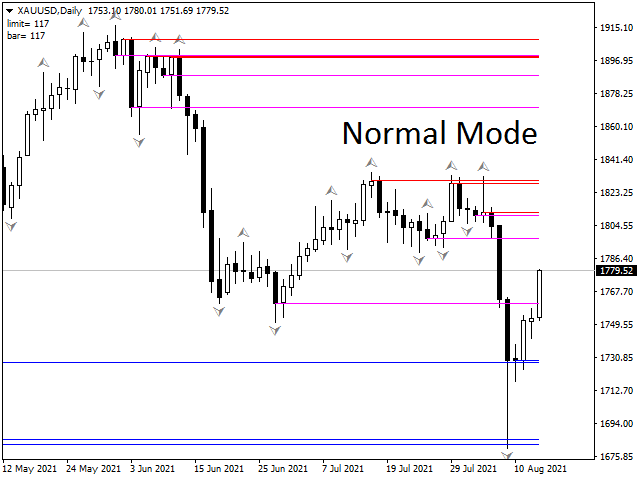


I found this tool to be an escential indicator for plotting the Support and Resistance zones and helps me to identify the "Reaction Zones" that will have major market movements. I found that the 1 Day timeframe worked best for identifying every type of SR (S,R,SbR,RbS,SbRbS,RbSbR) without creating a lot of clutter. The colors I that worked best for me (version 1.50) was S=CornflowerBlue, Resistance=Red, SbR=Magenta, RbS=Aqua, AbRFbS=Firebrick, RbSbR=SeaGreen. The only update I could see to be helpful would be to allow for the customization of the line widths. Thanks you so much for creating a fantatic indicator!