SR Breakup
- Indikatoren
- Version: 1.20
- Aktualisiert: 29 August 2020
- Aktivierungen: 5

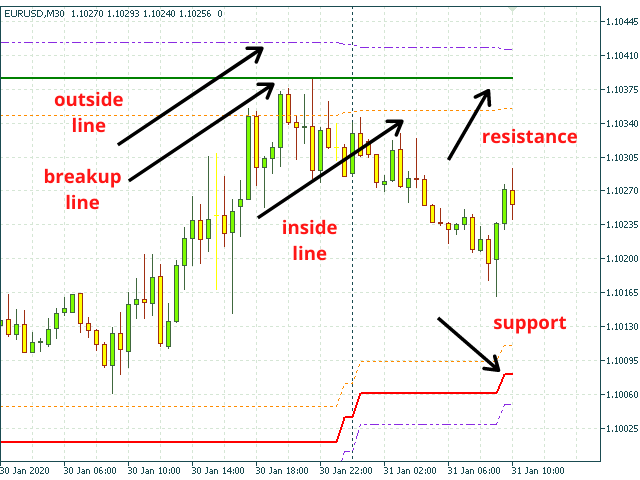
SR Breakup Indicator ist ein Indikator, der auf Unterstützung und Widerstand basiert. Er macht Preisausbruchsniveaus sichtbar, indem er den Verstand des Händlers öffnet, um Marktchancen zu erkennen.⭐⭐⭐⭐⭐
Achtung!!! Dieser Indikator kann in jedem Zeitrahmen verwendet werden.
Suggestion of use
- Warten Sie , bis die Unterstützungs- und Widerstandslinien horizontal sind und sich einander nähern.
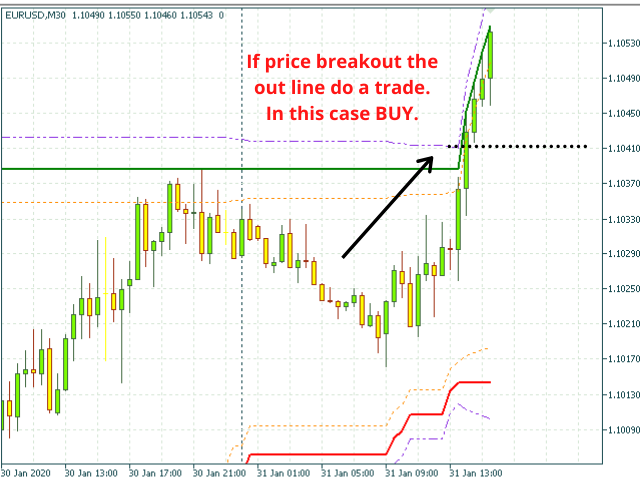
- Handeln (KAUFEN): wenn der Preis das Widerstandsniveau durchbricht (außerhalb der Linie).
- Handeln Sie (VERKAUFEN): wenn der Kurs die Unterstützungslinie durchbricht (außerhalb der Linie).
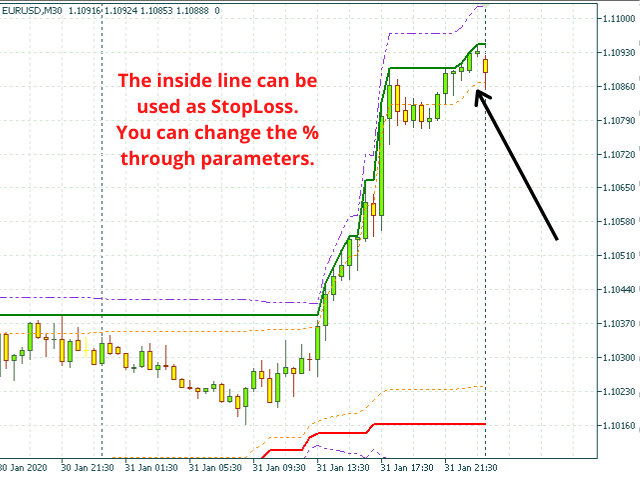
- Verwenden Sie interne Linien als StopLoss oder Pullback (optional).
Easy setup [PARAMETERS]
- Zeitraum: Anzahl der zu analysierenden Kerzen ✅.
- Inside Lines %: Prozentsatz der Unterstützung und des Widerstands innerhalb ✅
- Outside Lines %: Prozentsatz der Unterstützung und des Widerstands außerhalb ✅
Help
Wenn Sie Fragen haben, wenden Sie sich an unsere Telegrammgruppe:
☛ Telegrammgruppe
Viel Glück!