Variable Moving Average VMA MT5
- Indikatoren
-
Chidera Anakpe
 Over a decade ago, I discovered forex trading. I was instantly fascinated by it, while trading and learning new techniques, hours seemed like minutes and days seemed like hours. I soon discovered the greatest risk to a trader is not the strategy but managing emotions. Emotional trading was behind
 - Version: 1.0
- Aktivierungen: 5
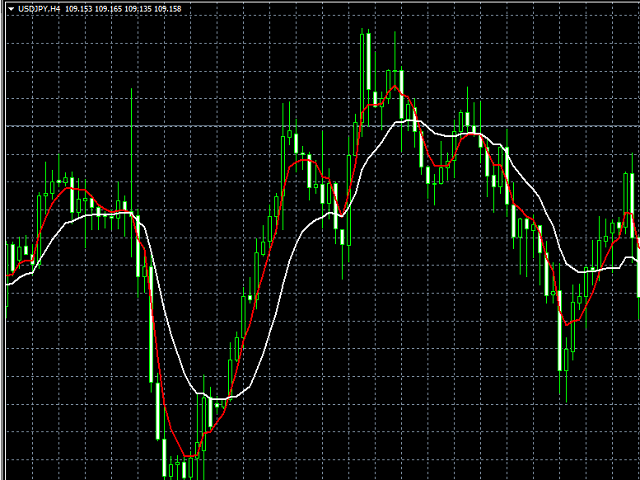
Der VMA ist ein exponentieller gleitender Durchschnitt, der seine Glättungskonstante auf der Grundlage der Marktvolatilität anpasst. Seine Empfindlichkeit nimmt zu, wenn die Volatilität der Daten zunimmt. Auf der Grundlage des Momentum-Oszillators von Chande kann der VMA seine Glättungsperiode automatisch anpassen, wenn sich die Marktbedingungen ändern, und hilft Ihnen so, Trendumkehrungen und Rückschritte im Vergleich zu herkömmlichen gleitenden Durchschnitten viel schneller und zuverlässiger zu erkennen.