Gamma Bands
- Indikatoren
-
Ziheng Zhuang
 About me:a C/C++ programmer and forex trader, develop MT4/5 apps from October 2007.
Email: admin@fxmeter.com
My products: https://www.mql5.com/en/users/fxmeter/seller - Version: 3.0
- Aktualisiert: 9 April 2025
- Aktivierungen: 5
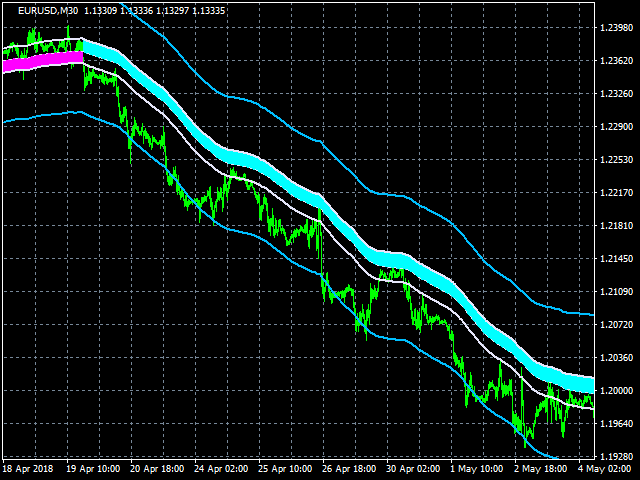
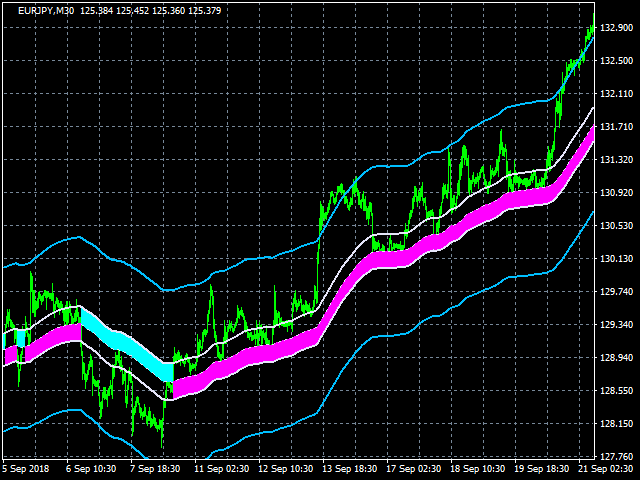
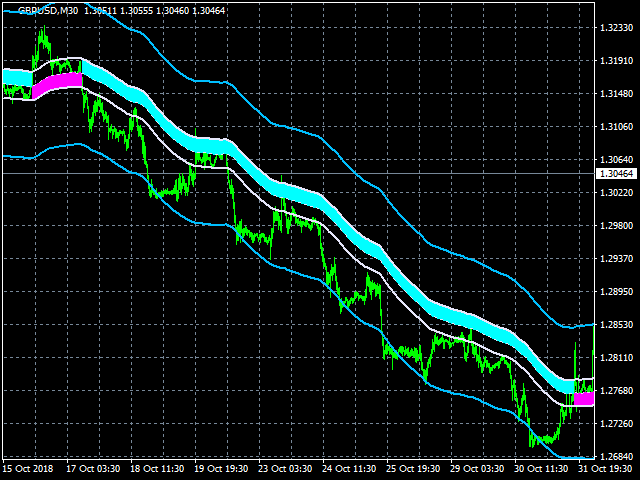
Dieser Indikator zeigt den Trend mit dem Farbhistogramm an. Er ist einfach und leicht zu bedienen.
Anwendung:
- Wenn sich das Histogramm von aqua nach fuchsia ändert, bedeutet dies, dass der Trend nach oben geht.
- Wenn das Histogramm von fuchsia zu aqua wechselt, bedeutet dies, dass der Trend nach unten geht.
Eingaben:
- MaPeriods: die Perioden des gleitenden Durchschnitts.
- f1: der Multiplikator der inneren Bänder
- f2: der Multiplikator der äußeren Bänder
- Popup-Fenster-Alarm
- E-Mail-Warnung
- Mobile Push-Warnung
Warnungen
- Wenn der Trend von einem Long-Trend zu einem Short-Trend wechselt oder umgekehrt.
- Wenn der Kurs das äußere Band nach oben kreuzt, wird ein Alarm für schließende Kaufaufträge ausgelöst.
- Wenn der Preis das äußere Band nach unten kreuzt, wird ein Alarm für schließende Verkaufsaufträge ausgelöst.
Die Version für MT5: Gamma Bands


Der Benutzer hat keinen Kommentar hinterlassen