Ziheng Zhuang / Verkäufer
Veröffentlichte Produkte
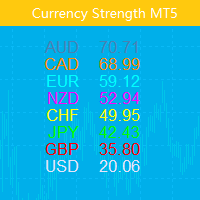
Dieser Indikator zeigt die relative Stärke von acht Hauptwährungen (USD, EUR, GBP, AUD, NZD, CAD, CHF, JPY). Kraftwerte werden im Bereich von 0 bis 100 normalisiert. Werte über 60 bedeuten stark. Ein Wert unter 40 deutet auf Schwäche hin.
Fahrkarte Only Show Current Pair - Bei „true“ wird nur das aktuelle Diagrammpaar angezeigt. Ansonsten werden alle acht Kurven angezeigt. Bars To Show – Anzahl der Balken zur Anzeige der Kraftkurve. Ma Periods To Smooth Curves : Gleitende Durch

Der Indikator besteht aus zwei Teilen. Teil I: Farbkerzen zeigen den großen Trend Farbkerzen dienen dazu, den Marktzustand anhand von Farbkerzen zu identifizieren. Wie in den Screenshots gezeigt, befindet sich der Markt in einem Zustand, in dem Sie Long-Orders platzieren oder Short-Orders beenden sollten, wenn die Farbe Aqua ist. Wenn die Farbe Tomate ist, ist es an der Zeit, Short-Orders aufzugeben oder Long-Orders zu beenden. Wenn sich die Farbe ändert, ist es besser, auf den Abschluss zu wart

Dieser Indikator zeigt den Haupttrend, die Einstiegszone und die Ausstiegszone an. Es handelt sich um einen Multi-Timeframe-Indikator, d.h. er wird immer in der aktuellen Periode des höheren Timeframes neu gezeichnet.
Merkmale Farbiges Histogramm: es zeigt den Haupttrend an, die Tomate bedeutet, dass der Markt bärisch ist, und das Himmelblau bedeutet, dass der Markt bullisch ist. Innere blaue Bänder: es ist die Einstiegszone für den Einstieg in den Markt, der Markt ist relativ sicher für den E

Dieser EA wurde entwickelt, um die Slippage von Eröffnungs- und Schließungsaufträgen zu überwachen und die Datensätze in einer csv-Datei zu speichern. Er ist nützlich, um die Slippage aufzuzeichnen und Broker zu bewerten. Die Aufzeichnungsdateien werden im Ordner MT5_Data_Folder\MQL5\Files gespeichert. Gehen Sie auf "File " --> "Open Data Folder" . Warnung : Öffnen Sie die Dateien NICHT direkt, da sonst die Ausführung des EA beeinträchtigt wird, kopieren Sie sie einfach in einen anderen Ordner
FREE

Dieser EA wurde entwickelt, um die Slippage von Eröffnungs- und Schließungsaufträgen zu überwachen und die Aufzeichnungen in Dateien zu speichern. Er ist nützlich, um die Slippage aufzuzeichnen und Broker zu bewerten. Die Aufzeichnungsdateien werden im Ordner MT4_Data_Folder\MQL4\Files gespeichert. Gehen Sie auf "File " --> "Open Data Folder" . Achtung ! Öffnen Sie die Dateien NICHT direkt, da sonst die Ausführung des EA beeinträchtigt wird, kopieren Sie sie einfach in einen anderen Ordner und
FREE
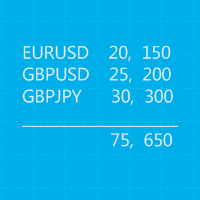
Dies ist ein MetaTrader 4 Skript. Es hilft dabei, alle Trades in jedem Symbol zusammenzufassen.
Eingabe Wählen Sie den Zeitraum: Dies ist eine 7-fache Eingabe. Sie umfasst letzten Monat, diesen Monat, letzte Woche, diese Woche, heute, die gesamte Historie und das angegebene Datum. Startdatum angeben: Geben Sie ein Datum ein, wenn Sie in der Eingabe "Zeitraum auswählen" die Option "Datum angegeben" gewählt haben. Enddatum angeben: Geben Sie ein Datum ein, wenn Sie unter "Zeitraum auswählen" die
FREE
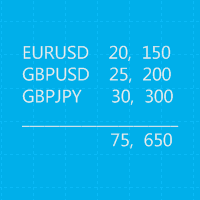
Dies ist ein MetaTrader 5 Skript. Es hilft dabei, alle Trades in jedem Symbol zusammenzufassen.
Eingabe Wählen Sie den Zeitraum: Dies ist eine 7-fache Eingabe. Sie umfasst letzten Monat, diesen Monat, letzte Woche, diese Woche, heute, die gesamte Historie und das angegebene Datum. Startdatum angeben: Geben Sie ein Datum ein, wenn Sie in der Eingabe "Zeitraum auswählen" die Option "Datum angegeben" gewählt haben. Enddatum angeben: Geben Sie ein Datum ein, wenn Sie in der Eingabe "Zeitraum auswäh
FREE
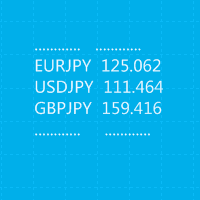
Dies ist ein MetaTrader 4 Skript. Es hilft, alle Trades in eine CSV-Datei nach Symbol und ausgewählten Zeiträumen zu exportieren.
Eingabe Symbol auswählen: Dies ist eine 2-Optionen-Eingabe. Wählen Sie das aktuelle Symbol oder alle Symbole, um deren Aufträge zu exportieren. Zeitraum auswählen: Dies ist eine Eingabe mit 7 Optionen. Sie umfasst letzten Monat, diesen Monat, letzte Woche, diese Woche, heute, die gesamte Historie und das angegebene Datum. Geben Sie das Startdatum an: Geben Sie ein Da
FREE

Dieser Advisor bietet die folgenden Funktionen: Eröffnen Sie eine Position: Eröffnen Sie eine Long- oder Short-Order, wenn der Preis die Trendlinie kreuzt. Schließen: Schließen Sie eine Long- oder Short-Position, wenn der Preis die Trendlinie kreuzt. Trailing Stop Loss – Der EA erhöht weiterhin den Stop-Loss für Long-Orders oder verringert den Stop-Loss für Short-Orders entlang der Trendlinie. Die Linie kann eine Trendlinie oder eine horizontale Linie sein. Trendlinien können Radien oder S
Dieses Gremium ist ein Fachberater und bietet 6 Gruppen von Handelspanels. MT5-Version: Schnelle Panelabdeckung
Merkmale Die meisten Handelsvorgänge können schnell durch Klicken auf die Schaltflächen in diesen Bedienfeldern ausgeführt werden. Das Wechseln der Panels ist so einfach wie das Klicken auf die grüne Schaltfläche. Der EA kann auf einem visuellen Diagramm im Strategietester ausgeführt werden und bietet eine einfache Möglichkeit, den Handel auf der Grundlage historischer Daten zu üben
Dieser EA ist ein professionelles Handelstool, das flexibles Risikomanagement und 6 Sätze von Handelspanels integriert. MT5-Version: Quick Panel Pro Hedging Merkmale Stapelberechnungen sind schnell und einfach. Berechnungen erfolgen sofort, wenn Sie die Stopplinie verschieben. Die meisten Geschäftsvorgänge können mit einem Klick auf diese Bedienfelder schnell erledigt werden. Wechseln Sie schnell zwischen den Panels, indem Sie einfach auf die grüne Schaltfläche klicken. EA kann im Strategy Test
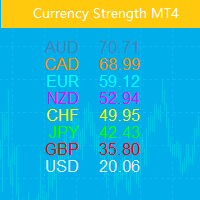
Dieser Indikator zeigt die relative Stärke von acht Hauptwährungen (USD, EUR, GBP, AUD, NZD, CAD, CHF, JPY). Kraftwerte werden im Bereich von 0 bis 100 normalisiert. Werte über 60 bedeuten stark. Ein Wert unter 40 deutet auf Schwäche hin.
Das Grundprinzip Gegeben sind acht Währungen, USD, EUR, GBP, AUD, NZD, CAD, CHF, JPY, wobei jedes Paar aus zwei Währungen kombiniert werden kann, was insgesamt 28 Paare ergibt. Ein umgekehrter Algorithmus wird verwendet, um die Stärke der acht Währungen aus di

Dieser Indikator zeigt den Haupttrend im aktuellen Chart an.
Merkmale Dieser Indikator umfasst zwei Bänder, ein inneres weißes Band und ein äußeres blaues Band. Wenn die weiß gepunktete Linie die weiße durchgezogene Linie nach unten kreuzt, bedeutet dies, dass sich der Trend zum Bären verändert hat. Wenn die weiß gepunktete Linie die weiße durchgezogene Linie nach oben kreuzt, bedeutet dies, dass sich der Trend zu einem Aufwärtstrend verändert hat. Sobald die Kreuzung stattgefunden hat, wird si
Dieser Berater ist ein Dashboard, mit dem Sie mehrere Paare mit einem Klick handeln können. klicken Offen Schaltfläche zum Öffnen der Bestellung für das ausgewählte Paar. klicken schließen Schaltfläche zum Schließen der Bestellung für das ausgewählte Paar. Das Bestelllos ist die vom Benutzer eingegebene Nummer. Positive Zahlen entsprechen Kaufaufträgen, negative Zahlen entsprechen Verkaufsaufträgen. Um die gesamte Bestellung statt nur teilweise zu schließen, klicken Sie

Dieser Indikator zeigt den Trend mit dem Farbhistogramm an. Er ist einfach und leicht zu bedienen. Anwendung: Wenn sich das Histogramm von aqua nach fuchsia ändert, bedeutet dies, dass der Trend nach oben geht. Wenn das Histogramm von fuchsia zu aqua wechselt, bedeutet dies, dass der Trend nach unten geht. Eingaben: MaPeriods: die Perioden des gleitenden Durchschnitts. f1: der Multiplikator der inneren Bänder f2: der Multiplikator der äußeren Bänder Popup-Fenster-Alarm E-Mail-Warnung Mobile Push

Dieser Indikator wurde entwickelt, um die Stärke des Paares der 28 wichtigsten Pari mit RSI, Stochostic und CCI anzuzeigen. Der Potenzwert wird von schwach bis stark sortiert. Die schwachen Paare: die Paare kommen mindestens 2 Mal in den oberen 3 Zeilen vor Die stärkeren Paare: Die Paare kommen mindestens 2 Mal in den unteren 3 Zeilen vor. Benutzer können ein weiteres Symbol hinzufügen, so dass 28+1 Symbole berechnet werden können. Mein Rat: https://www.mql5.com/en/blogs/post/729880
Ein kosten

Der Zweck des Indikators ist es, den Umkehrpunkt zu identifizieren.
Der blaue Pfeil ist das Kaufsignal und der gelbe Stern ist der Stop Loss. Der rote Pfeil ist ein Verkaufssignal und der gelbe Stern ist der Stop-Loss. Alert-Funktion: Wenn es ein Signal gibt, wird der Indikator Alarme von Popup-Fenster, E-Mail oder mobile Push senden. Eingänge: Popup-Fenster-Alarm: ist standardmäßig falsch E-Mail-Warnung: standardmäßig falsch Mobile Push-Benachrichtigung: ist standardmäßig falsch. MetaTrader 5 V

Der Indikator besteht aus zwei Teilen. Teil I: Farbkerzen zeigen den großen Trend Farbkerzen dienen dazu, den Marktzustand anhand von Farbkerzen zu identifizieren. Wie in den Screenshots gezeigt, befindet sich der Markt in einem Zustand, in dem Sie Long-Orders platzieren oder Short-Orders beenden sollten, wenn die Farbe Aqua ist. Wenn die Farbe Tomate ist, ist es an der Zeit, Short-Orders aufzugeben oder Long-Orders zu beenden. Wenn sich die Farbe ändert, ist es besser, auf den Abschluss zu wart
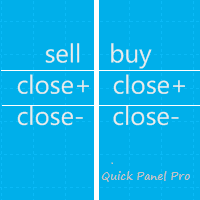
Überwachung. Dieser Berater ist nur für Absicherungskonten gedacht. Metatrader 4-Version Quick Panel Pro
Merkmale Stapelberechnungen sind schnell und einfach. Berechnungen erfolgen sofort, wenn Sie die Stopplinie verschieben. Die meisten Geschäftsvorgänge können mit einem Klick auf diese Bedienfelder schnell erledigt werden. Wechseln Sie schnell zwischen den Panels, indem Sie einfach auf die grüne Schaltfläche klicken. Stop-Loss schnell ändern und Gewinn mitnehmen per Mausklick (nicht fü
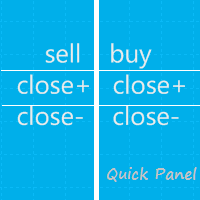
Hinweis: Dieser EA funktioniert nur auf Hedge-Konten. Metatrader 4-Version Schnellpanel Dieses Panel ist ein Expert Advisor, der 6 Gruppen von Handelspanels bietet.
Merkmale Die meisten Handelsvorgänge können schnell durch Klicken auf die Schaltflächen in diesen Bedienfeldern ausgeführt werden. Das Wechseln zwischen den Panels ist so einfach wie das Klicken auf die grüne Schaltfläche. Der EA kann auf einem visuellen Diagramm im Strategietester ausgeführt werden und bietet eine einfache M

Gamma-Bänder Dieser Indikator zeigt den Trend mit dem Farbhistogramm an. Er ist einfach und leicht zu bedienen. Anwendung: Wenn sich das Histogramm von aqua nach fuchsia ändert, bedeutet dies, dass der Trend nach oben geht. Wenn das Histogramm von fuchsia zu aqua wechselt, bedeutet das, dass der Trend nach unten geht. Eingaben: MaPeriods: die Perioden des gleitenden Durchschnitts. f1: der Multiplikator der inneren Bänder f2: der Multiplikator der äußeren Bänder Popup-Fenster-Alarm E-Mail-Warnung

Der Zweck des Indikators ist es, den Umkehrpunkt zu identifizieren.
Der blaue Pfeil ist das Kaufsignal und der gelbe Stern ist der Stop Loss. Der rote Pfeil ist ein Verkaufssignal und der gelbe Stern ist der Stop-Loss. Bitte beachten Sie, dass das Singal gegen den Trend ist, es könnte ein kontinuierlicher Fehlschlag sein. Alert-Funktion: Wenn es ein Signal gibt, wird der Indikator Warnungen von Popup-Fenster, E-Mail oder mobile Push senden. Eingänge: Popup-Fenster-Alarm: ist standardmäßig falsch

Dieser Advisor bietet die folgenden Funktionen: Eröffnen Sie eine Position: Eröffnen Sie eine Long- oder Short-Order, wenn der Preis die Trendlinie kreuzt. Schließen: Schließen Sie eine Long- oder Short-Position, wenn der Preis die Trendlinie kreuzt. Trailing Stop Loss – Der EA erhöht weiterhin den Stop-Loss für Long-Orders oder verringert den Stop-Loss für Short-Orders entlang der Trendlinie. Die Linie kann eine Trendlinie oder eine horizontale Linie sein. Trendlinien können Radien oder S
Dieser Berater ist ein Dashboard, mit dem Sie mehrere Paare mit einem Klick handeln können. klicken Offen Schaltfläche zum Öffnen der Bestellung für das ausgewählte Paar. klicken schließen Schaltfläche zum Schließen der Bestellung für das ausgewählte Paar. Das Bestelllos ist die vom Benutzer eingegebene Nummer. Positive Zahlen entsprechen Kaufaufträgen, negative Zahlen entsprechen Verkaufsaufträgen. Um die gesamte Bestellung statt nur teilweise zu schließen, klicken Sie
Veröffentlichte Signale
- Wachstum
- 0%
- Abonnenten
- 0
- Wochen
- 0
- Trades
- 0
- Win
- 0%
- Profit-Faktor
- n/a
- Max. Rückgang
- 0%