Crossover System
- Indikatoren
- Version: 1.0
- Aktivierungen: 5

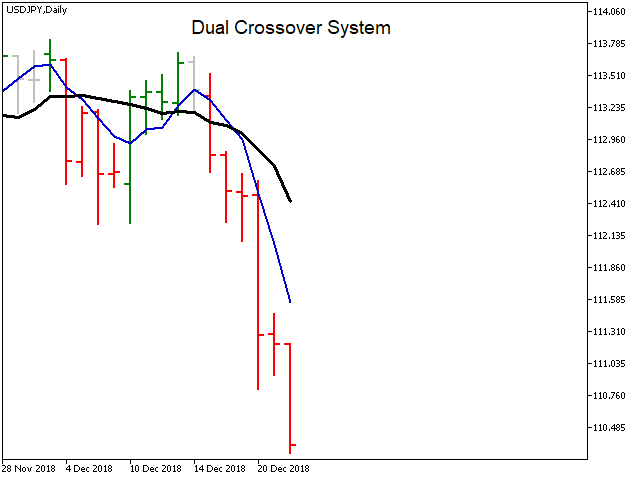
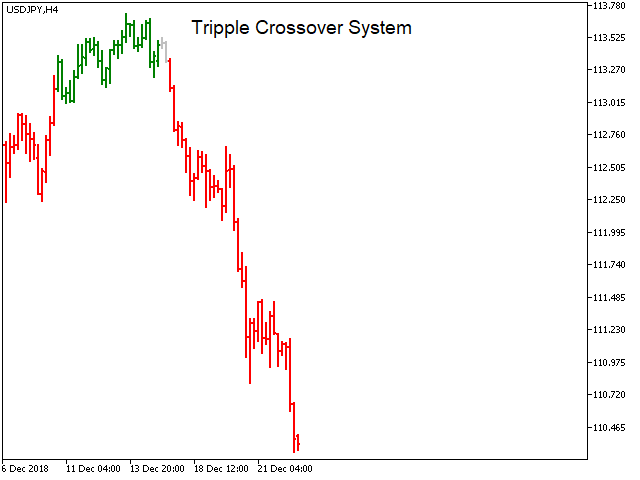
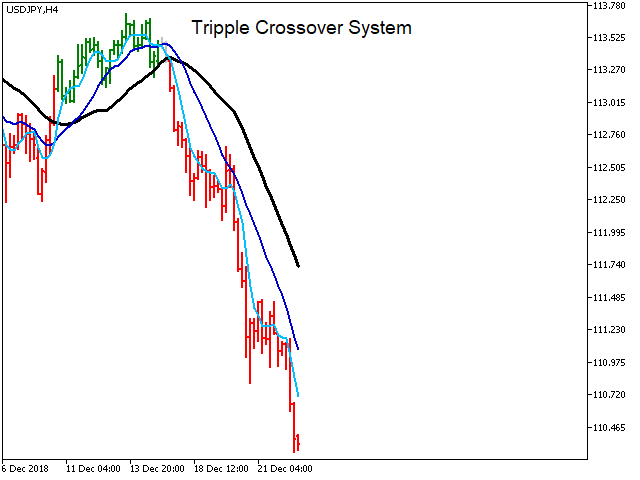
Der Crossover-System-Indikator basiert auf drei gleitenden Durchschnitten, die die Farbe der Balken in Abhängigkeit von bestimmten Bedingungen des gleitenden Durchschnitts ändern.
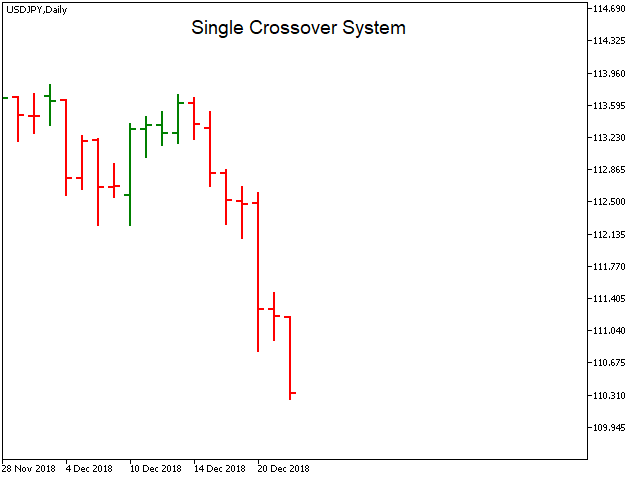
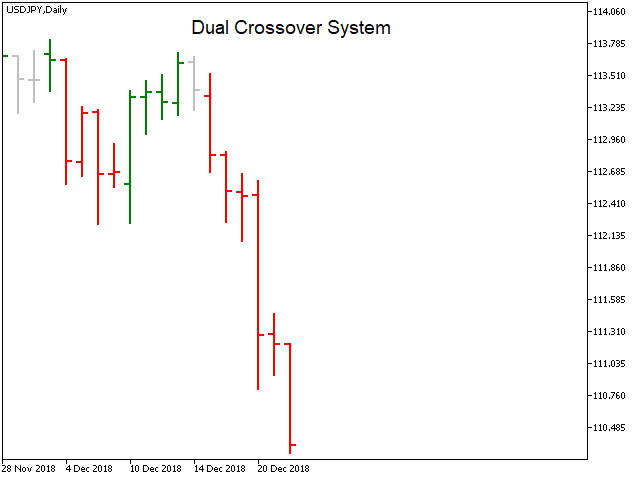
Mit diesem Indikator können Sie Systeme mit einem gleitenden Durchschnitt, zwei gleitenden Durchschnitten und drei gleitenden Durchschnitten umsetzen.
Parameter des Indikators:
- fastperiod - Periode des schnellen gleitenden Durchschnitts
- fastMethod - Methode zur Bildung eines schnellen gleitenden Durchschnitts
- fastPrice - Methode zur Berechnung einesschnellen gleitenden Durchschnitts
- fastshift - Verschiebung des schnellen gleitenden Durchschnitts relativ zum Chart
- mediumperiod - Periode des mittleren gleitenden Durchschnitts
- mediumMethod - Methode zur Bildung des gleitenden Durchschnitts
- mediumPrice - Berechnungsmethode des durchschnittlichen gleitenden Durchschnitts
- mediumshift - Verschiebung des gleitenden Durchschnitts relativ zum Chart
- slowperiod - Periode des langsamen gleitenden Durchschnitts
- slowMethod - Methode zur Bildung eines langsamen gleitenden Durchschnitts
- slowPrice - Methode zur Berechnung des langsamen gleitenden Durchschnitts
- slowshift - Verschiebung des langsamen gleitenden Durchschnitts relativ zum Chart
Farbe:
- Grüne Farbe - Bullenmarkt
- Rote Farbe - Bärenmarkt
- Silberne Farbe - Neutraler Markt
Sie brauchen Ihr Diagramm nicht mehr mit gleitenden Durchschnitten zu überladen. Sie können Ihre Eingabeparameter verwenden, um Ihre farbigen Balken zu erhalten.
Beispiel #1 der Parameter für einen einzelnen MA
- fastperiod - 1
- fastMethod - Einfach
- fastPrice - Schlusskurs
- fastshift - 0
- mittlere Periode - 5
- mediumMethode - Einfach
- mediumPreis - Schließen
- mediumVerschiebung - 0
- langsamZeitraum - 5
- slowMethod - Einfach
- slowPrice - Schließen
- langsame Verschiebung - 0
Beispiel #2 der Parameter für Dual MA
- fastperiod - 1
- fastMethod - Einfach
- fastPrice - Schließen
- fastshift - 0
- mittlere Periode - 5
- mediumMethode - Einfach
- mediumPreis - Schließen
- mediumVerschiebung - 0
- langsamZeitraum - 10
- slowMethod - Einfach
- slowPrice - Schließen
- slowshift - 0
Beispiel #3 Parameter für den Alligator-Indikator
- fastperiod - 5
- fastMethod - Geglättet
- fastPrice - Medianpreis
- fastshift - 3
- mittelPeriode - 8
- mediumMethode - geglättet
- mediumPrice - Mittelwert des Preises
- mediumshift - 5
- langsamZeitraum - 13
- slowMethod - Geglättet
- slowPrice - Mittlerer Preis
- slowshift - 8