Bloc Convergence
- Indikatoren
- Version: 1.0
- Aktivierungen: 20
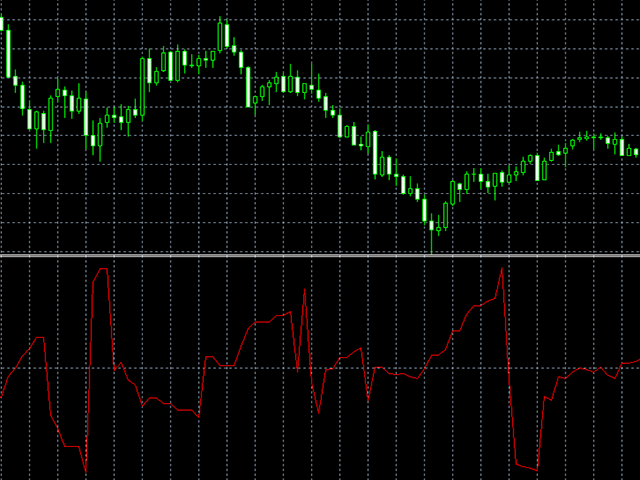
Der Block von Balken wird unter der Bedingung der Konvergenz gesammelt. Wenn die Konvergenzbedingungen nicht erfüllt sind, wird der Block gelöscht. Genauer gesagt ist die Bedingung der Übergang des Blocks von Balken vom Zustand der Konvergenz zum Zustand der Divergenz. Blöcke werden selektiv mit Lücken gebildet. Lücken sind durch den Zustand der Divergenz der Balken gekennzeichnet.
Der Indikator zeigt den Konvergenzwert an. Liegt der Indikator unter Null, wird der Block nicht gebildet und die Balken werden übersprungen. Wenn der Indikator unter Null liegt, werden die entgegengesetzten Bedingungen gebildet - Divergenzen. (Um einen Block durch die Bedingung der Divergenz zu bilden, siehe hier)
Um die Richtung und Stärke des Preises im Block zu bestimmen, siehe hier, die Linie der extremen Balken innerhalb des Blocks, siehe hier.
Der Indikator hat keine Einstellungen.