Pairs Arbitrage Correlation
- Indikatoren
- Vladimir Tkach
- Version: 2.8
- Aktualisiert: 25 Mai 2020
- Aktivierungen: 5
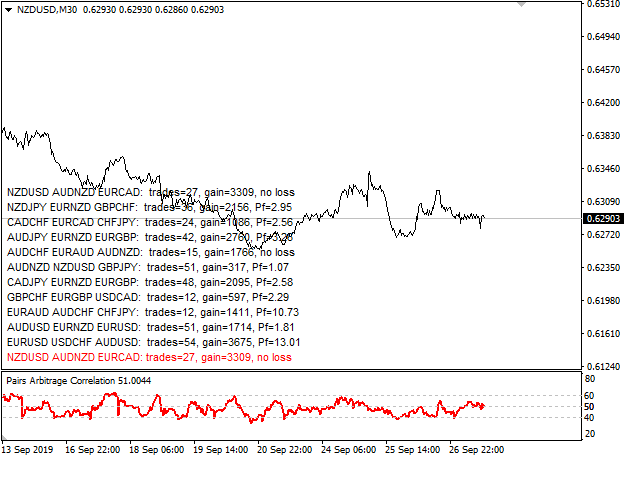
Der Kreuzkorrelationsindikator berechnet die Beziehung zwischen den angegebenen Paaren für den vorherigen Zeitraum. Er wählt automatisch die Instrumente mit der höchsten und der niedrigsten Korrelation aus und simuliert dann den Handel mit den ausgewählten Paaren für denselben Testzeitraum. Anschließend zeigt der Indikator die Paare an, die die besten Handelsergebnisse gezeigt haben. Visualisiert das PAC-Kriterium (Pairs Arbitrage Correlation) für die vom Händler ausgewählten Paare. Das Signal zur Eröffnung von Geschäften wird durch die PAC-Werte festgelegt. Wenn ein Signal erscheint, wird eine Nachricht an die E-Mail oder das mobile Endgerät gesendet.
Telegrammkanal zur Diskussion der Präferenzen und Verbesserungsvorschläge: https: //t.me/joinchat/FZd4EhXEiEnAx7sybTh01Q
Wenn Sie den Signalen des Indikators nicht folgen und den Handel manuell eröffnen möchten, verwenden Sie den PACman expert Advisor https://www.mql5.com/ru/market/product/41991
Wichtigste Parameter
- Hauptpaar - Hauptinstrument;
- Erstes Paar - das erste Instrument mit minimaler Korrelation;
- Zweites Paar - das zweite Instrument mit geringer Korrelation;
- Suffix - zusätzliches Suffix zum Paarnamen;
- Start at - Startzeit des Zeitraums, der zur Analyse und Ermittlung der Korrelation verwendet wird;
- Ende um - Endzeit des Zeitraums;
- Tage ausschließen - Ausschluss von Wochentagen von der Analyse und der Suche nach Korrelationen;
- Niedrigste negative, % - minimale Korrelation für das erste Paar;
- Neutral, % - neutrale Korrelation für das zweite Paar;
- Mobile mt4 Benachrichtigung senden - Nachricht an mobile mt4$ senden
- E-Mail senden, wenn untere Levels überschritten werden - E-Mail senden, wenn ein Signal vorliegt;
- Level für Verkauf - PAC Level für Verkaufstrades;
- Close all sells - PAC-Level zum Schließen aller Verkäufe;
- Level für Kauf - PAC-Level für Kaufgeschäfte;
- Alle Käufeschließen - PAC-Level, um alle Käufe zu schließen;
- Zeichen 1 - USDCHF
- Zeichen 2 - GBPUSD
- Symbol 23 - NZDUSD
...