Strength Graph
- Indikatoren
- Version: 1.0

Dieser Indikator ist ein Instrument zur Messung der relativen Stärke der verschiedenen Währungspaare. Er zeigt die Stärke der Hauptwährungen auf der Grundlage ihrer relativen Stärke/Schwäche in einem bestimmten Zeitraum an.
Parameter des Indikators
- Stärkeperiode - Die Änderung der Stärkeperiode in den Einstellungen wirkt sich auf die Anzahl der für die Berechnung verwendeten Balken aus. Je höher der Wert für den Zeitraum, desto glatter sind die Linien des Indikators und das Ergebnis stellt die längerfristige Stärke der einzelnen Währungen dar und nicht die aktuelle Stärke.
- Anzeigeoptionen - Wählen Sie die Anzeigeoptionen, die sich auf die visuelle Darstellung der Daten auswirken. (Stärke/Schwäche/Kebab anzeigen).
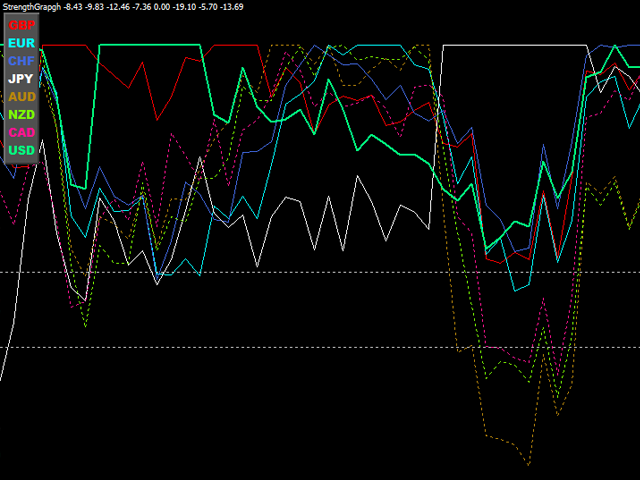
- Im Modus "Stärke anzeigen" wird der Wert einer Währung umso höher, je stärker sie ist. Die schwächste Währung wird mit dem Wert 0 angezeigt.
- Im Modus "Schwäche anzeigen" ist der Wert einer Währung umso niedriger, je schwächer sie ist. Die stärkste Währung hat dann den Wert 0.
- Im Modus "Kebab anzeigen", je stärker eine Währung wird, desto höher ist ihr Wert. Der durchschnittliche Wert einer Währung liegt bei 50.
Dieser Indikator ist nützlich, wenn Sie versuchen, nicht nur mit den Hauptpaaren, sondern auch mit verschiedenen Cross-Paaren zu handeln.
Wenn dieser Indikator nicht richtig funktioniert, müssen Sie wahrscheinlich zwischen verschiedenen Zeitrahmen wechseln und warten, bis er aktualisiert wird.
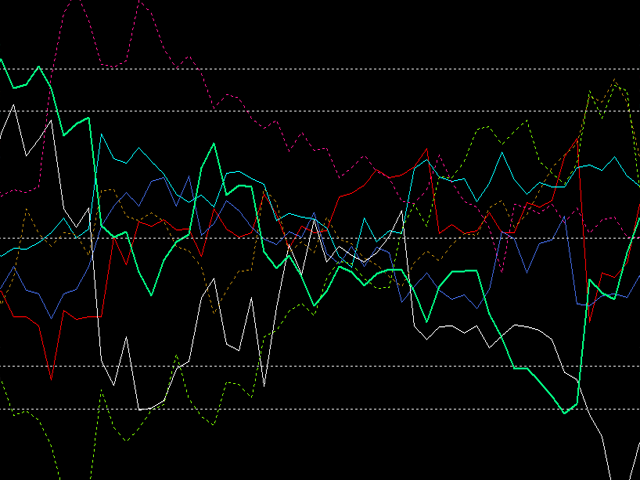
Das Fenster des Indikators, das den Bereich der Datenwerte anzeigt, kann in den Einstellungen angepasst werden. Sie können die Farben und Stile der Indikatorlinien ändern, um sie Ihren visuellen Vorlieben anzupassen. Um die Währungslinie zu deaktivieren, wählen Sie "keine" für ihre Farbe.

for verification of winning rate