Macd Multi Time Frame
- Indikatoren
- FXsolutions
- Version: 1.2
- Aktivierungen: 10
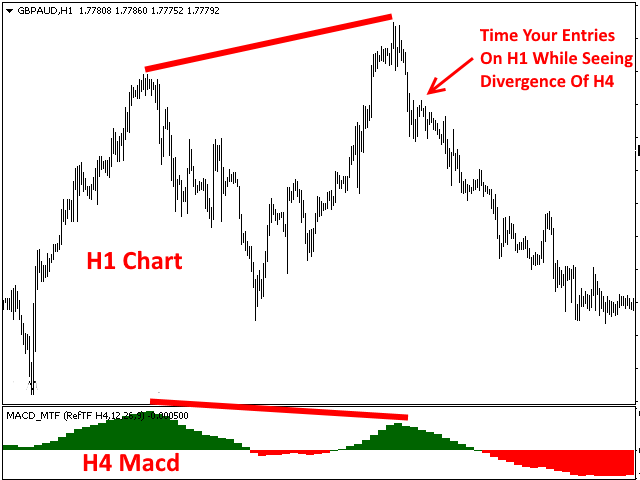
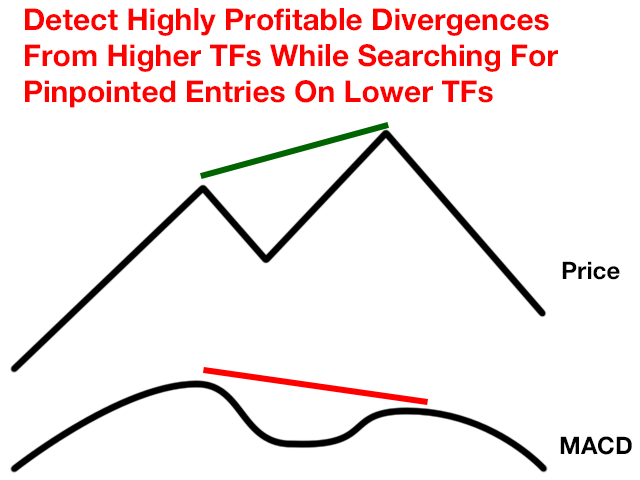
Mit dem MACD Multi Time Frame Indikator können Sie Divergenzen auf höheren Zeitebenen erkennen, während Sie auf niedrigeren Zeitebenen nach gezielten Einstiegsmöglichkeiten suchen.
In diesem Blog-Beitrag erhalten Sie eine kostenlose Echtzeit-MACD-Divergenzanalyse und Tipps, wie Sie die Divergenzen handeln können: MACD-Divergenz-Analyse in Echtzeit
Der MACD Multi Time Frame verschafft Ihnen einen sehr guten Überblick über das Geschehen auf höheren Zeitebenen, ohne dass Sie auf die höhere Zeitebene wechseln müssen. Sie sehen z.B. immer den MACD-Wert des Zeitrahmens H4, während Sie nach Einstiegsmöglichkeiten auf H1 oder M30 suchen.
Parameter
- referenceTF - Eine Dropdown-Box, in der Sie den Zeitrahmen des MACD auswählen können. Der Wert des MACD dieses Zeitrahmens wird in den niedrigeren Zeitrahmen angezeigt.
- fastEMA - Die Periode des schnellen EMA des MACD (standardmäßig 12)
- slowEMA - Die Periode des langsamen EMA des MACD (standardmäßig 26)
- signal - Die Periode des Signals des MACD (standardmäßig 9)


very useful tool. Thank you.